- Image formation and principles
- Quantitative measures of image quality
- Image filters
- Impact on image quality
- Image reconstruction
- Backprojection and filtered backprojection
- Iterative
- DICOM, PACS
- Image format, transfer and storage
Medical Imaging Uses and Requirements
The most basic goal of medical imaging is to be able to non-invasively (no cutting open) see inside patients. We can do this through the strategic use of radiation or sound.
Photographs can capture external information because those images are formed by visible light reflecting off surfaces. To view internal information, we use other types of radiation that can pass through tissue. For these types of radiation, the tissue is essentially transparent or translucent.
Because internal structures vary in shape and material, it is possible to display them with different brightnesses, or intensities, on images. The relative brightness depends on the tissues, the modality, and the techniques used within the modality.
In diagnostic imaging, radiologists look for changes, abnormalities and asymmetries to identify an ailment. To do so, the image quality must meet some minimum criteria. In general, images need to be clear, not blurry, show sufficiently small structures, and have good contrast between adjacent structures. What is considered “good” and “sufficient” depends heavily on the clinical task.
In radiation oncology (RO) the most important imaging use is CT for treatment planning and daily setup, although RO is increasingly relying on a variety of imaging modalities to enhance treatment.
Image Formation and Principles
Images can be formed by transmitting photons through a patient to a detector (X-ray, CT), by collecting photons being emitted from a patient (PET, SPECT), by exciting and emitting radiofrequency waves (MRI), or by sending and receiving sound waves (US). The energy of photons must be quite high to pass through a patient (otherwise only external reflections can be images), thus the photons used in X-ray, CT, PET and SPECT are ionizing radiation.
Imaging Modalities
Imaging modalities covered herein include planar x-ray, computed tomography (CT), magnetic resonance imaging (MRI), positron emission tomography (PET), single photon emission computed tomography, and ultrasound (US). We also cover a few sub-types and special uses.
Image Formation
Matrix, Pixels and Field of View
Digital images are stored in arrays (matrices) of picture elements (pixels). 3D images use 3D matrices, and each element is called a voxel (volumetric pixel). Each pixel has a value or intensity, the same as a photograph. However, medical images are almost universally stored in grayscale, and the meaning of the pixel value varies based on the modality and settings used.
The matrix size determines how many pixels are included in the image. Many images are stored in square matrices with sizes that are powers of 2: 16×16, 64×64, 128,128, 256×256, 512×512.
The pixel size (typically in mm) and matrix size determine the size of the image. A 256×256 matrix of 0.5 mm pixels covers 128×128 mm.
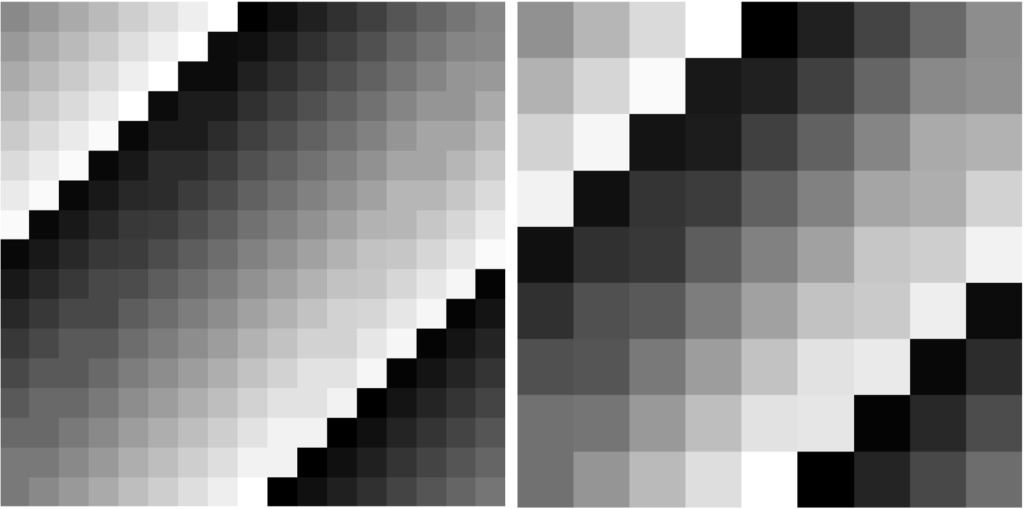
Increasing the matrix size and keeping the same pixel size will result is a larger field of view (FOV, physical area included in the image). Increasing the matrix size without changing the field of view results in smaller pixels.
Imaging systems often allow the selection matrix size, pixel size, and/or “zoom” (typically reduces FOV and pixel size). Generally one chooses the highest zoom/smallest pixel size such that the region of interest is included in the FOV.
Here an example x-ray image is shown with different pixel sizes. Each image covers the same physical dimensions – 40 cm x 40 cm – but has a different number of pixels, and thus each pixel is a different size. Pixels that are too large lead to loss of detail in the image.
What is the pixel size for each of the three images?
Given the image size of 40 cm x 40 cm, a matrix size of 1024 leads to a pixel size of 40 cm / 1024 = 0.39 mm. Similarly, 40 cm / 128 = 3.1 mm and 40 cm / 64 = 6.25 mmPixel Values
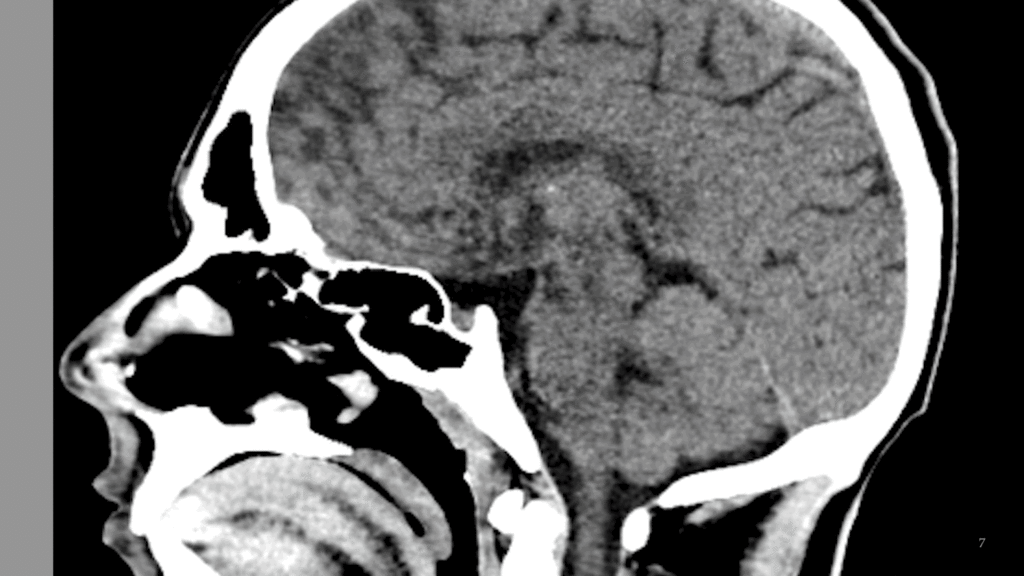
Each pixel in a medical image has a “gray value” number indicating the intensity or brightness of that pixel. It is analogous to the red/green/blue (RGB) colors contributing to pixels in photographs. What that gray value quantity represents depends on the imaging modality, parameters/technique, and processing. The number of gray levels used to store or display an image can affect the quality. While the human eye distinguishes fewer than 256-levels of gray, medical images can store many more levels. The viewer0 can then adjust how those levels are displayed to show the best contrast. Sometimes the images are displayed with false color using a colormap/look-up-table. If an image has 8 gray levels, the lightest might be mapped to dark blue, then light blue, cyan, green, yellow, orange, red, and the darkest to dark red. The underlying data however are still stored as single numbers, not the RGB format found in digital photographs.

Dynamic Range
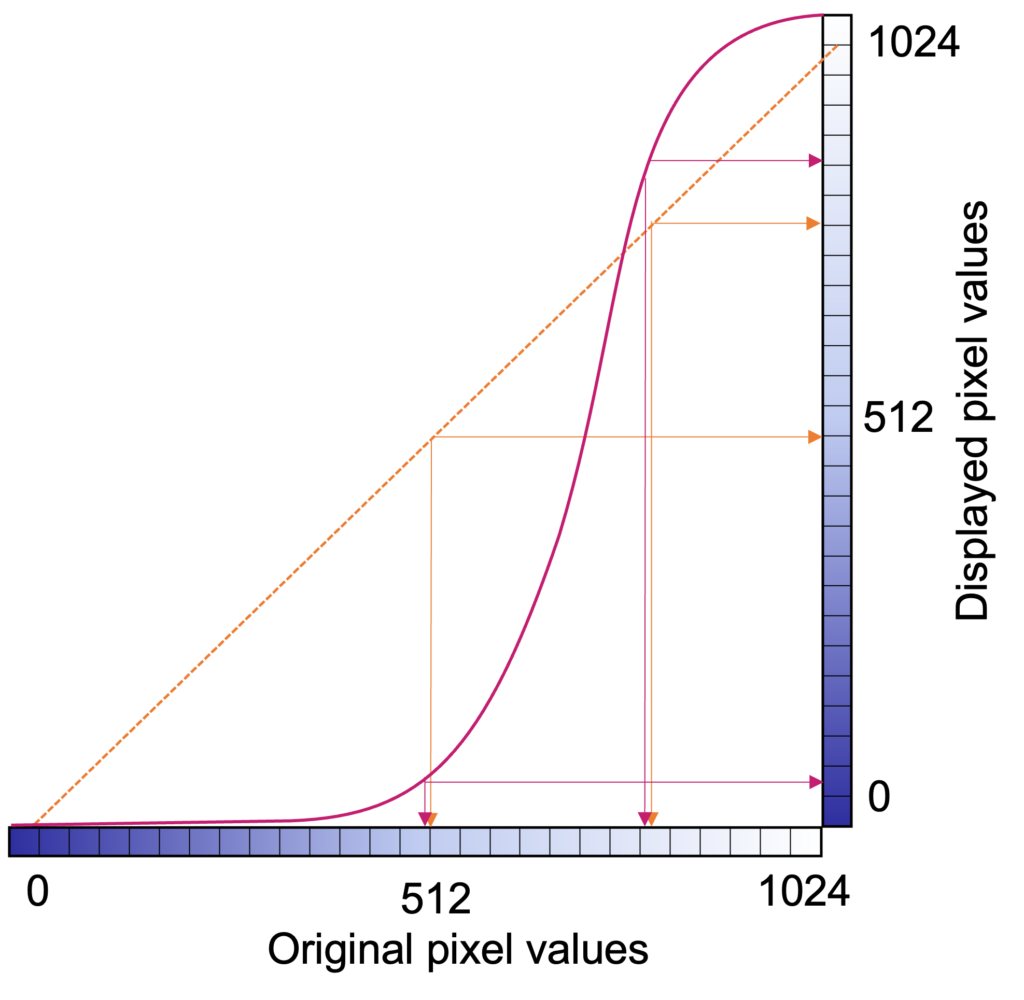
The number of grayscale levels, or “quantized brightness”, in an image depends on the number of bits (0/1) available for each pixel. Modern images have a “bit depth” of 12 or 16, resulting in 2^12 = 4,096 of 2^16 = 65,535 levels or shades of gray. A bit depth of N results in 2^N gray levels, since each bit can be 0 or 1. The greater the number of gray levels, or “dynamic range”, the more accurately subtle differences in color or gray tone can be reproduced. The dynamic range for an image system depends on the design, hardware, and software characteristics.
In CT and MRI, the bit depth is usually 12, while nuclear medicine images are stored in 16-bit. However, most displays are 8-bit (10-bit for fancier monitors). Again, this is because the human eye can’t distinguish between different grays if the range of white to black is split into more than 256 divisions.
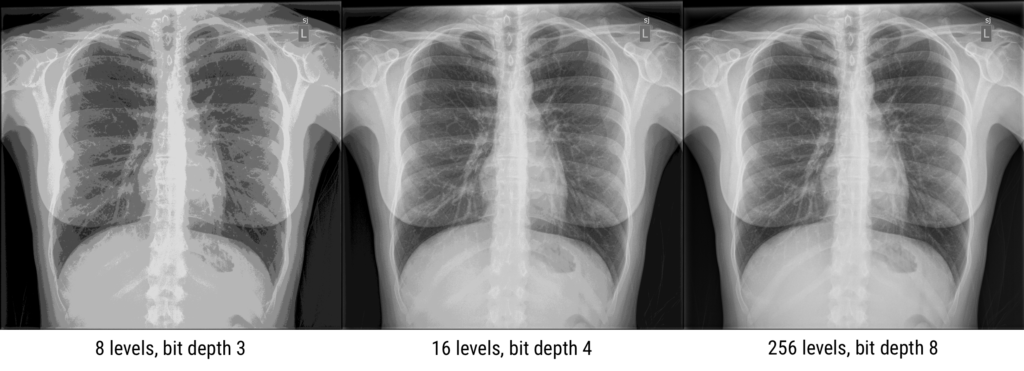
If the dynamic range is too small, details are lost and false contours can be created because transitions between different intensities are not smooth. The full dynamic range of images can be utilized by adjusting the display window to emphasize different parts of an image. Look-up-tables (LUTs) or equations are used to transform the true brightness (gray) values into adjusted values to accentuate certain elements of an image. These transformations maintain the order of brightness (or invert), so that, for example, bone will always be brighter than muscle, but it might not always look as much brighter.

In the days of film, the qualities of the film and technique dictated the dynamic range, which was often limited, but with digital imaging, there is much more flexibility, and large dynamic ranges are almost always possible.
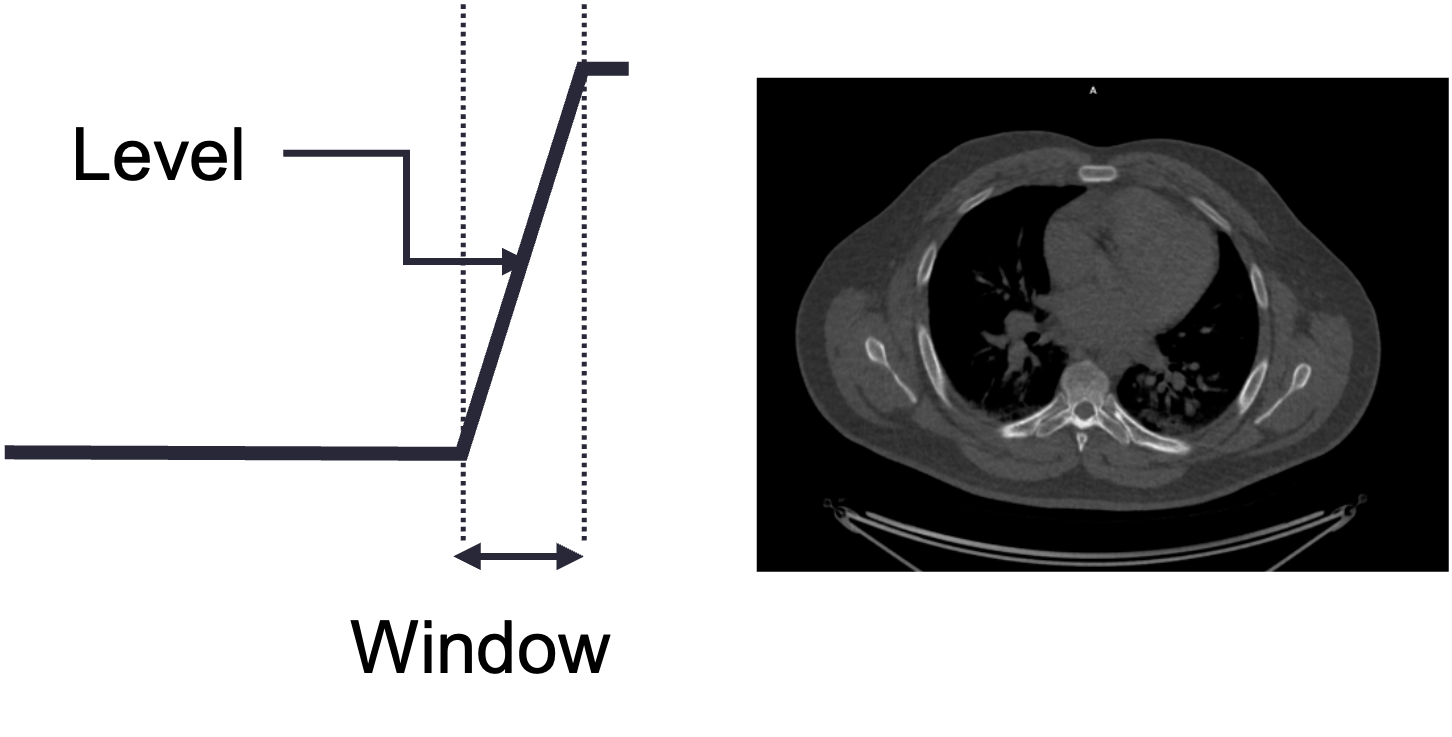
The user displaying a medical image will select a particular center/level and window to display. The level indicates the center of the window, and the width indicates the range of grays. The figure below uses a chest CT slice as an example of how changing the level and window can affect what the user sees. It is possible emphasize different parts of the subject such as soft tissue vs lung vs bone, which all have different brightness ranges on CT. Oftentimes, scanner and processing software will have present windows and levels corresponding to accentuating various tissue types.
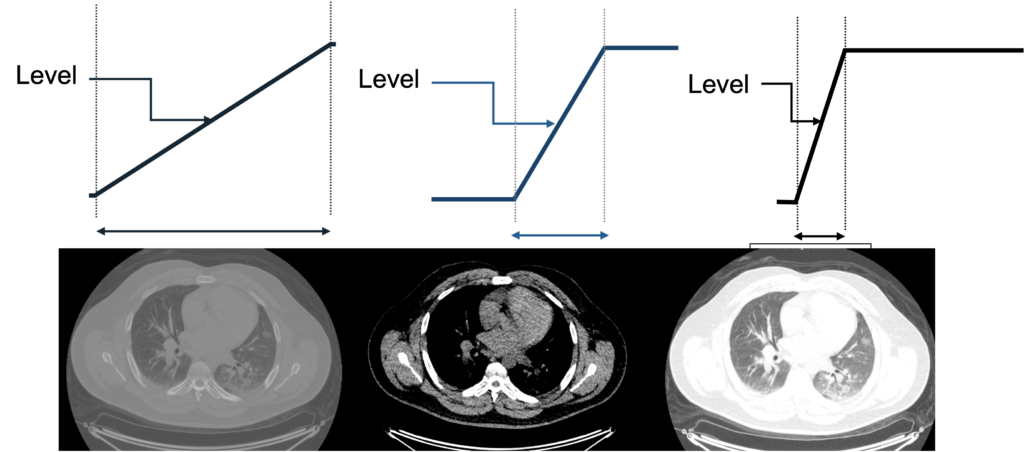
What would this image look like with a narrow level shifted to the right? What tissues would be best visualized?
Question: A 4-bit image has how many gray levels?
N = 4, and dynamic range = 2N thus the image has 24 = 16 gray levelsQuestion: An image with 2048 gray scales has what bit depth?
N = log2(2048) = 11(211 = 2048)
ADC
The bit depth of a system depends on the analog-to-digital converter (ADC) hardware. The ADC takes input voltages from the detector system and puts them in discrete bins. The number and size of the bins determine the grayscale resolution (dynamic range)
Image Quality
It is often important to be able to quantify image quality. It is useful for assessing the quality of an imaging system, comparing imaging systems, and knowing whether a particular system will be good enough for a particular task. There is typically a cost to better imaging quality – money, time, radiation dose – so the goal is to balance the cost with the clinical need.
The main image quality measures are spatial resolution, noise, signal, and contrast. Combinations of these qualities are often used. Artifacts, which are very modality dependent, also factor in, although they are harder to quantify.
Resolution
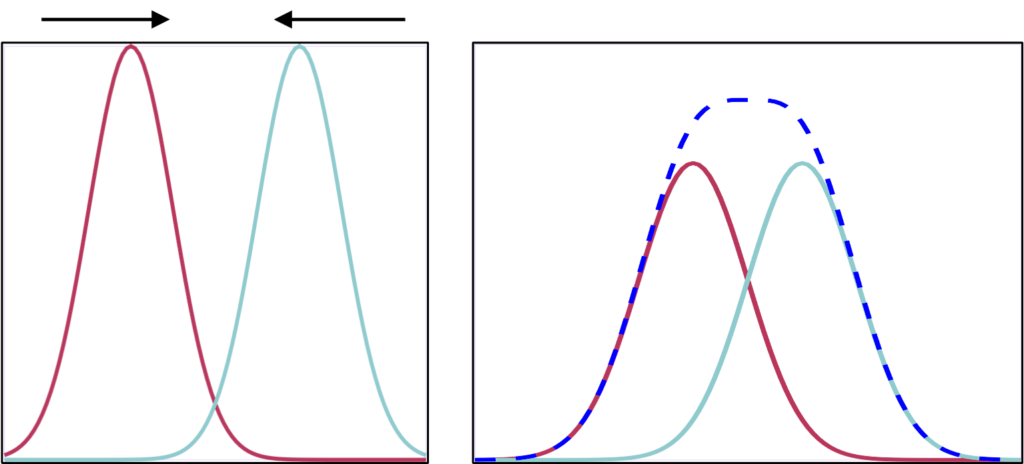
Spatial resolution represents how much detail an image can show. It is a measure of the smallest object that can be resolved (visualized) by a detector. It is also how much distance must be between two features so that they can be seen individually and not as one larger shape. Unsharpness and resolution in medical imaging refer to the degree of blurring along the boundaries between different regions of the image (usually defined by different patient organs). Better resolution results in sharper edges, and smaller objects that are more distinct.
Pixel size affects the resulting resolution of an image. It is important to use a pixel size half or less than the resolution of a system. Otherwise, small objects and edges can potentially be combined within a single pixel, and details are lost. However, every imaging system has an intrinsic resolution, so producing images with smaller and smaller pixels won’t necessarily result in sharper images.
There are multiple ways to measure and characterize resolution:
Line pairs
One of the most common is similar to a standard optical test: for pairs of black lines on a white background, how close can they be before they blur together. The units of this measurement are line pairs per mm (lp/mm). A test object will have several sets of line pairs with different spacing. Imaging is performed using the object and the resulting images are assessed to determine at what spacing the line are no longer distinct.
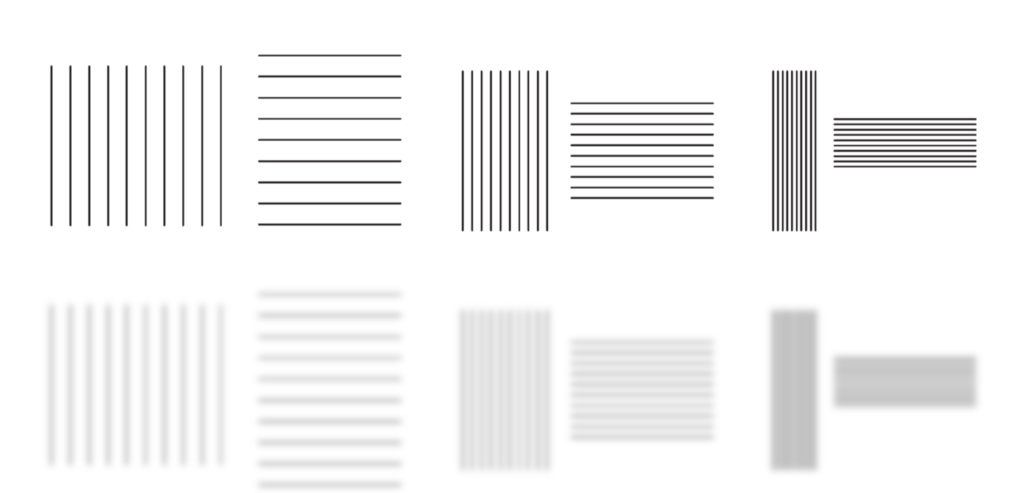
Line spread function
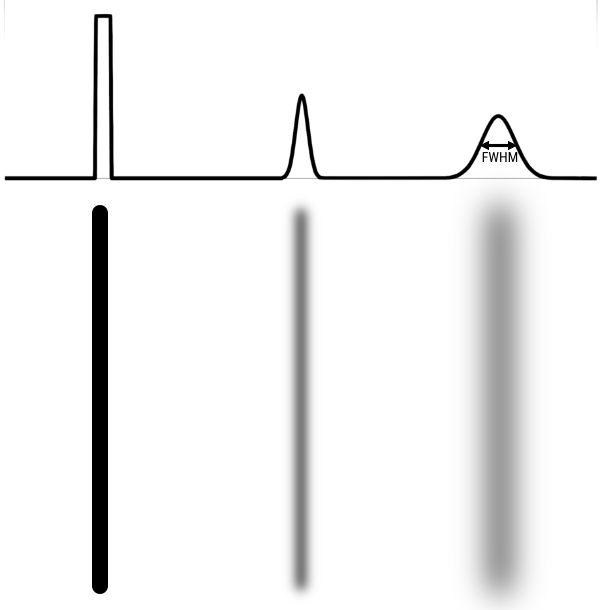
Measuring the line spread function (LSF) can provide more detailed quantification of resolution than picking out a set of lp/mm that can no longer be resolved. With the LSF, a single numbers in 2 dimensions can be calculated to describe the resolution. In this case, a thin line, at least less than half of the expected resolution, is imaged. A profile is drawn perpendicular (in 2 dimensions) to the line. From that profile one can calculate the Full Width Half Max (FWHM). FWHM is calculated by finding the maximum/peak value then finding the width of the profile at half that value. If the profile is gaussian shaped, FWHM = 2.355 σ, where σ is the standard deviation.
Point spread function
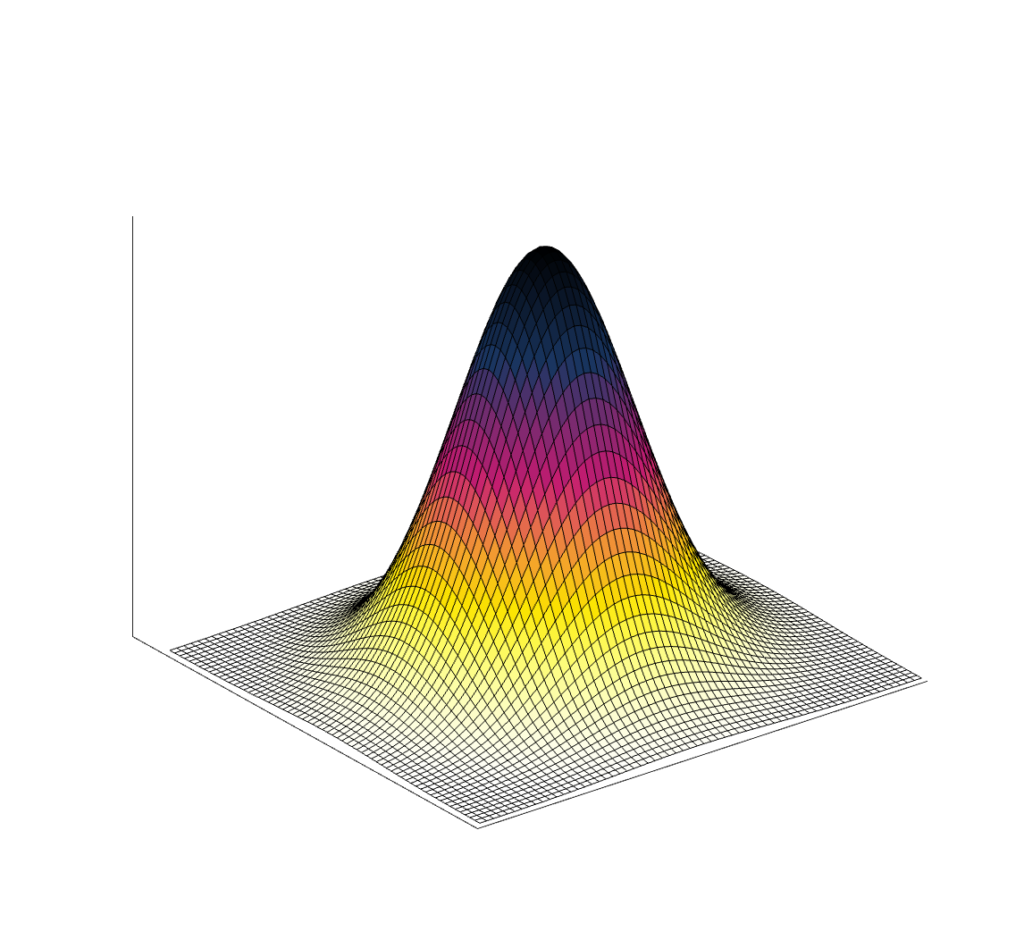
Because many medical images are three-dimensional, it is helpful to have a 3D resolution measurement. Thus, instead of using a thin line, we can measure a small point in three dimensions. Most imaging systems are not symmetric, which means not all directions will have the same spatial resolution. (In addition, resolution can also change across an image.)
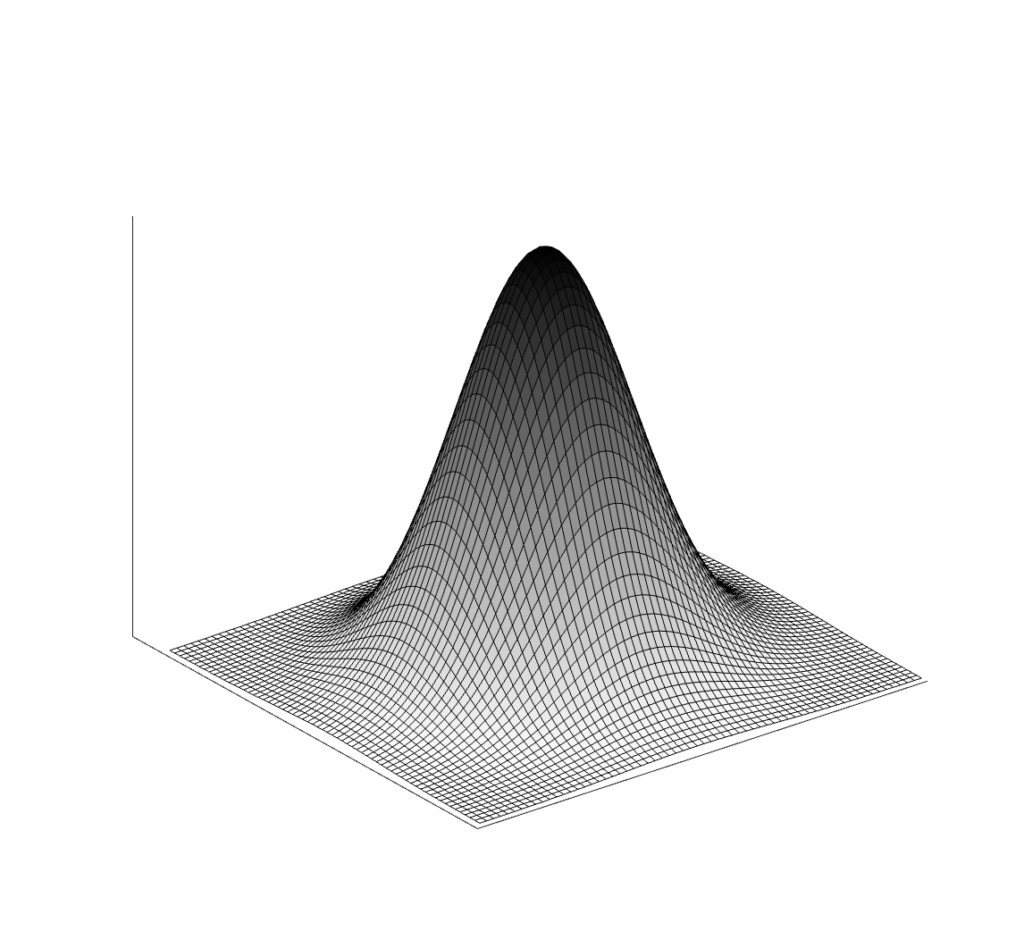
The result of imaging a small point source is a Point Spread Function (PSF). The image of a very small point source will always show some amount of spreading, which we again measure with FWHM.

Modulation transfer function (advanced)
The modulation transfer function (MTF) is the Fourier transform of the PSF, converting from space to frequency. The MTF provides more information about a system than a single number like FWHM. A narrow PSF (good resolution) will result in a broad MTF. The MTF shows the response of a system over spatial frequencies. It is usually 1 for very low frequencies, and drops gradually to zero. At high frequencies the MTF will be zero, indicating that those very small objects cannot be visualized individually.
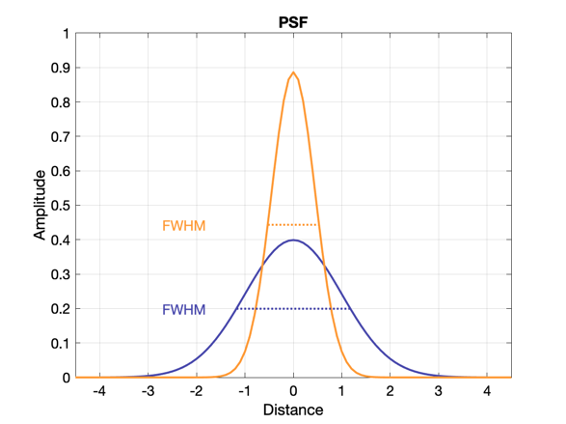
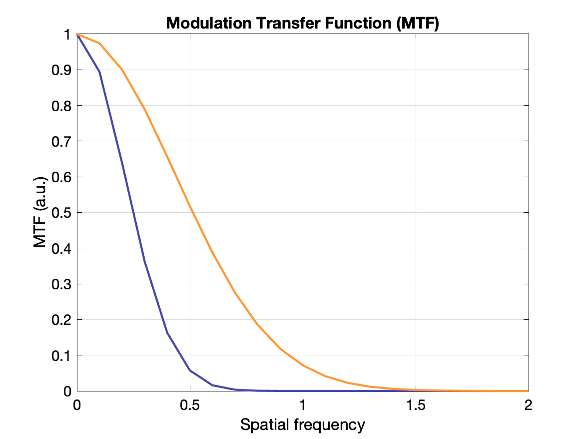
Which system above has better spatial resolution? What are the respective FWHMs?
Orange has better spatial resolution because the PSF is narrower (smaller FWHM), and the MTF is wider. FWHM orange ~ 1 and FWHM of purple ~ 2.2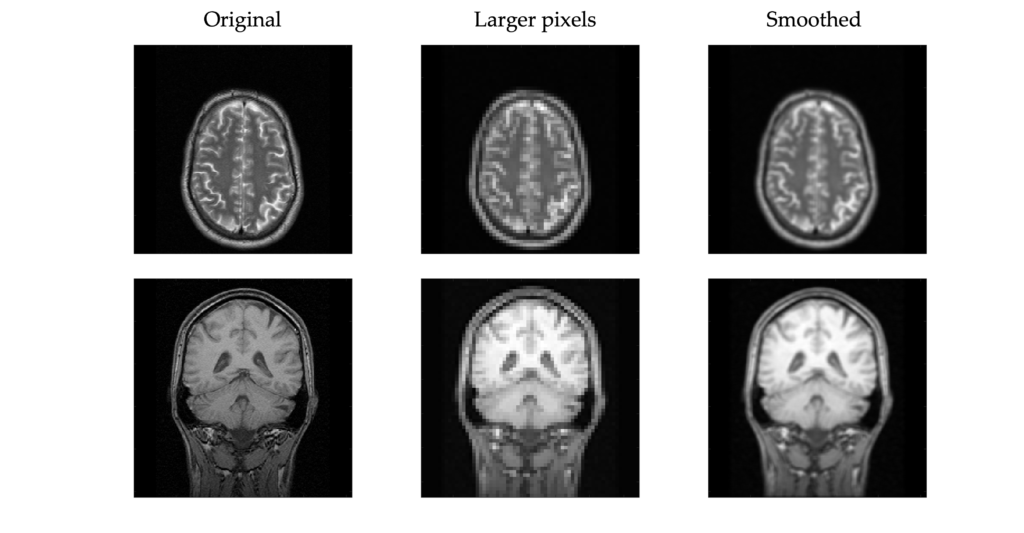
Noise
Noise is unwanted data or variability that is not part of the signal. In a lot of medical imaging, this comes from statistical effects, “statistical noise”. There is not unlimited information that can be gathered, so there are statistical fluctuations in the pixels of an image. Noise can also come from electronic or detector noise in the hardware. The noise typically appears as speckles or mottle and is essentially the same as noise seen in photographs taken in low lighting. This noise can mask small objects and those with low contrast.
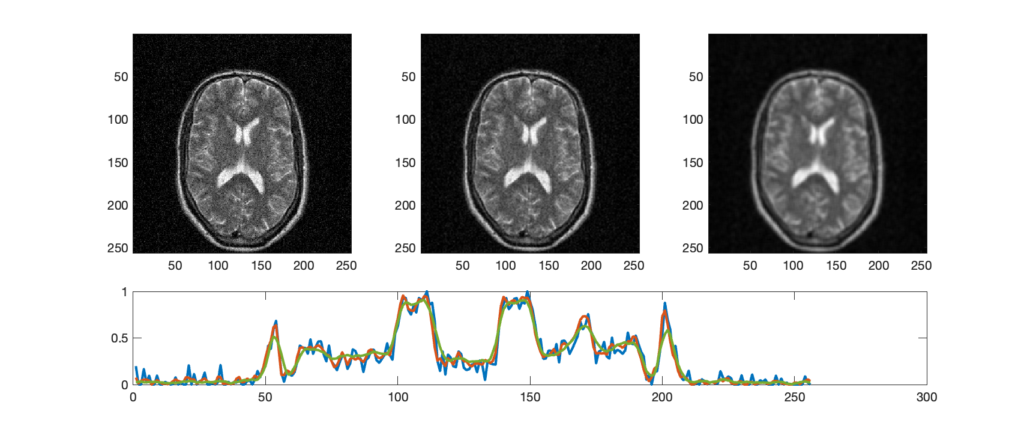
Noise is often measured as the standard deviation of pixel values within a particular region of interest (ROI). For systems with Poisson noise, the standard deviation should equal the square root of the mean pixel value: σ = √N. The important consequence of this relationship is that it takes 4x as much signal to reduce the noise by 2x.
Noise is affected by the type of imaging system, the parameters used, and post-processing (e.g. filters), applied to the images. Noise can be reduced by averaging multiple images (requires motionless object), but that usually requires more time or more radiation dose.
Noise power spectrum (advanced)
The NPS describes the noise intensity vs frequency. “White noise” has equal power at all frequencies; There is no structure to it. Correlated noise results in an NPS that typically drops for higher spatial frequencies and patterns can be observed. NPS can be a useful metric for comparing imaging systems and techniques.
Signal and SNR
Signal is the measurement that comes from the subject. In x-ray imaging, the signal is the x-rays that traveled directly through the subject to the detector. More signal generally means better images, but also requires more time or dose. Rather than measuring the raw signal, the more useful metric is Signal-to-Noise Ratio (SNR). SNR is the signal relative to the background. More signal will not produce a better image if there is also a lot more unwanted background noise.
SNR = \(C_S/C_N\) (signal contrast / noise contrast)

SNR = \((A – B)/\sqrt(B) = C_S \sqrt(B)\) (signal contrast / square root background)
Full mathematical description:
The require SNR depends on the clinical task, but the Rose Criterion states that if SNR > 5, the signal region will be detectable in most cases.
To improve SNR, one can increase the signal by improving the sensitivity of the detector, increasing the intensity (e.g. use more x-rays). One can also decrease the noise by improving and recalibrating equipment to reduce electronic noise, using advanced software techniques to reduce random events, or applying filtering.
Contrast and CNR
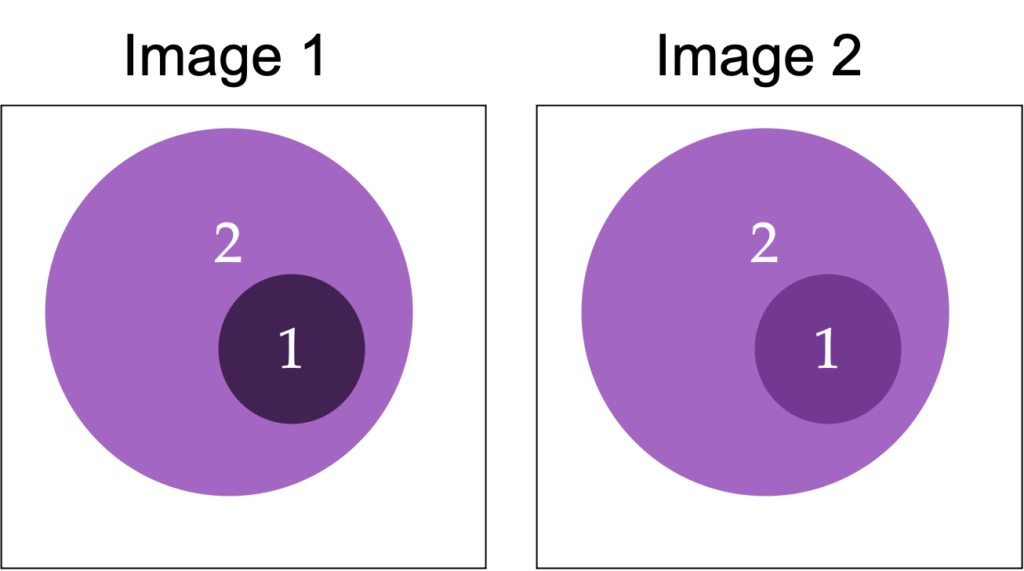
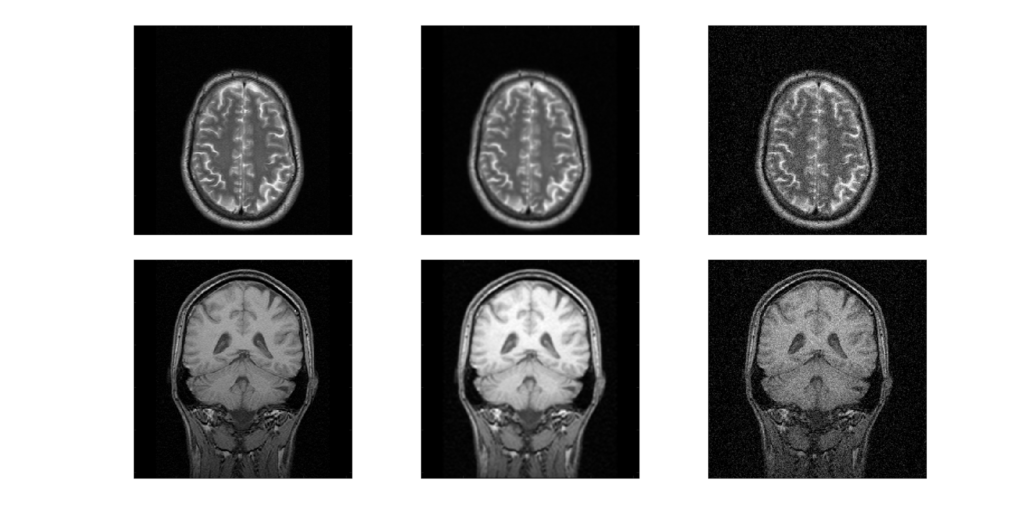
Contrast is a measure of the difference in brightness, counts, or optical density in adjacent regions of an image.
Mathematically is can be expressed as the difference in counts of values between two objects, or the relative difference:
C = (D1 – D2)
C = (D1 – D2) / (1/2 (D1+D2))
C = (D1 – D2) / D2
Subject Contrast
This is the contrast inherent in the image information, independent of the means of display. It comes from differences within the object being measured.
Even with great SNR and resolution, without contrast in the subject it is not possible to distinguish between two structures. For instance, this can make distinguishing different soft tissues in CT difficult (similar density and effective atomic numbers), but bone very visible (denser, higher Z).
Detector contrast
Varies with the means used to capture the image – it depends on detector response vs input signal.
Displayed contrast
Varies with the means used to display the latent image information. As demonstrated above, displayed contrast can be increased by changing the window/level (i.e., the LUT) on the display software.
Object size and scatter
For small legions (areas of abnormality), the peak resolution may be reduced by the blurring from the poor spatial resolution, thus reducing the contrast.
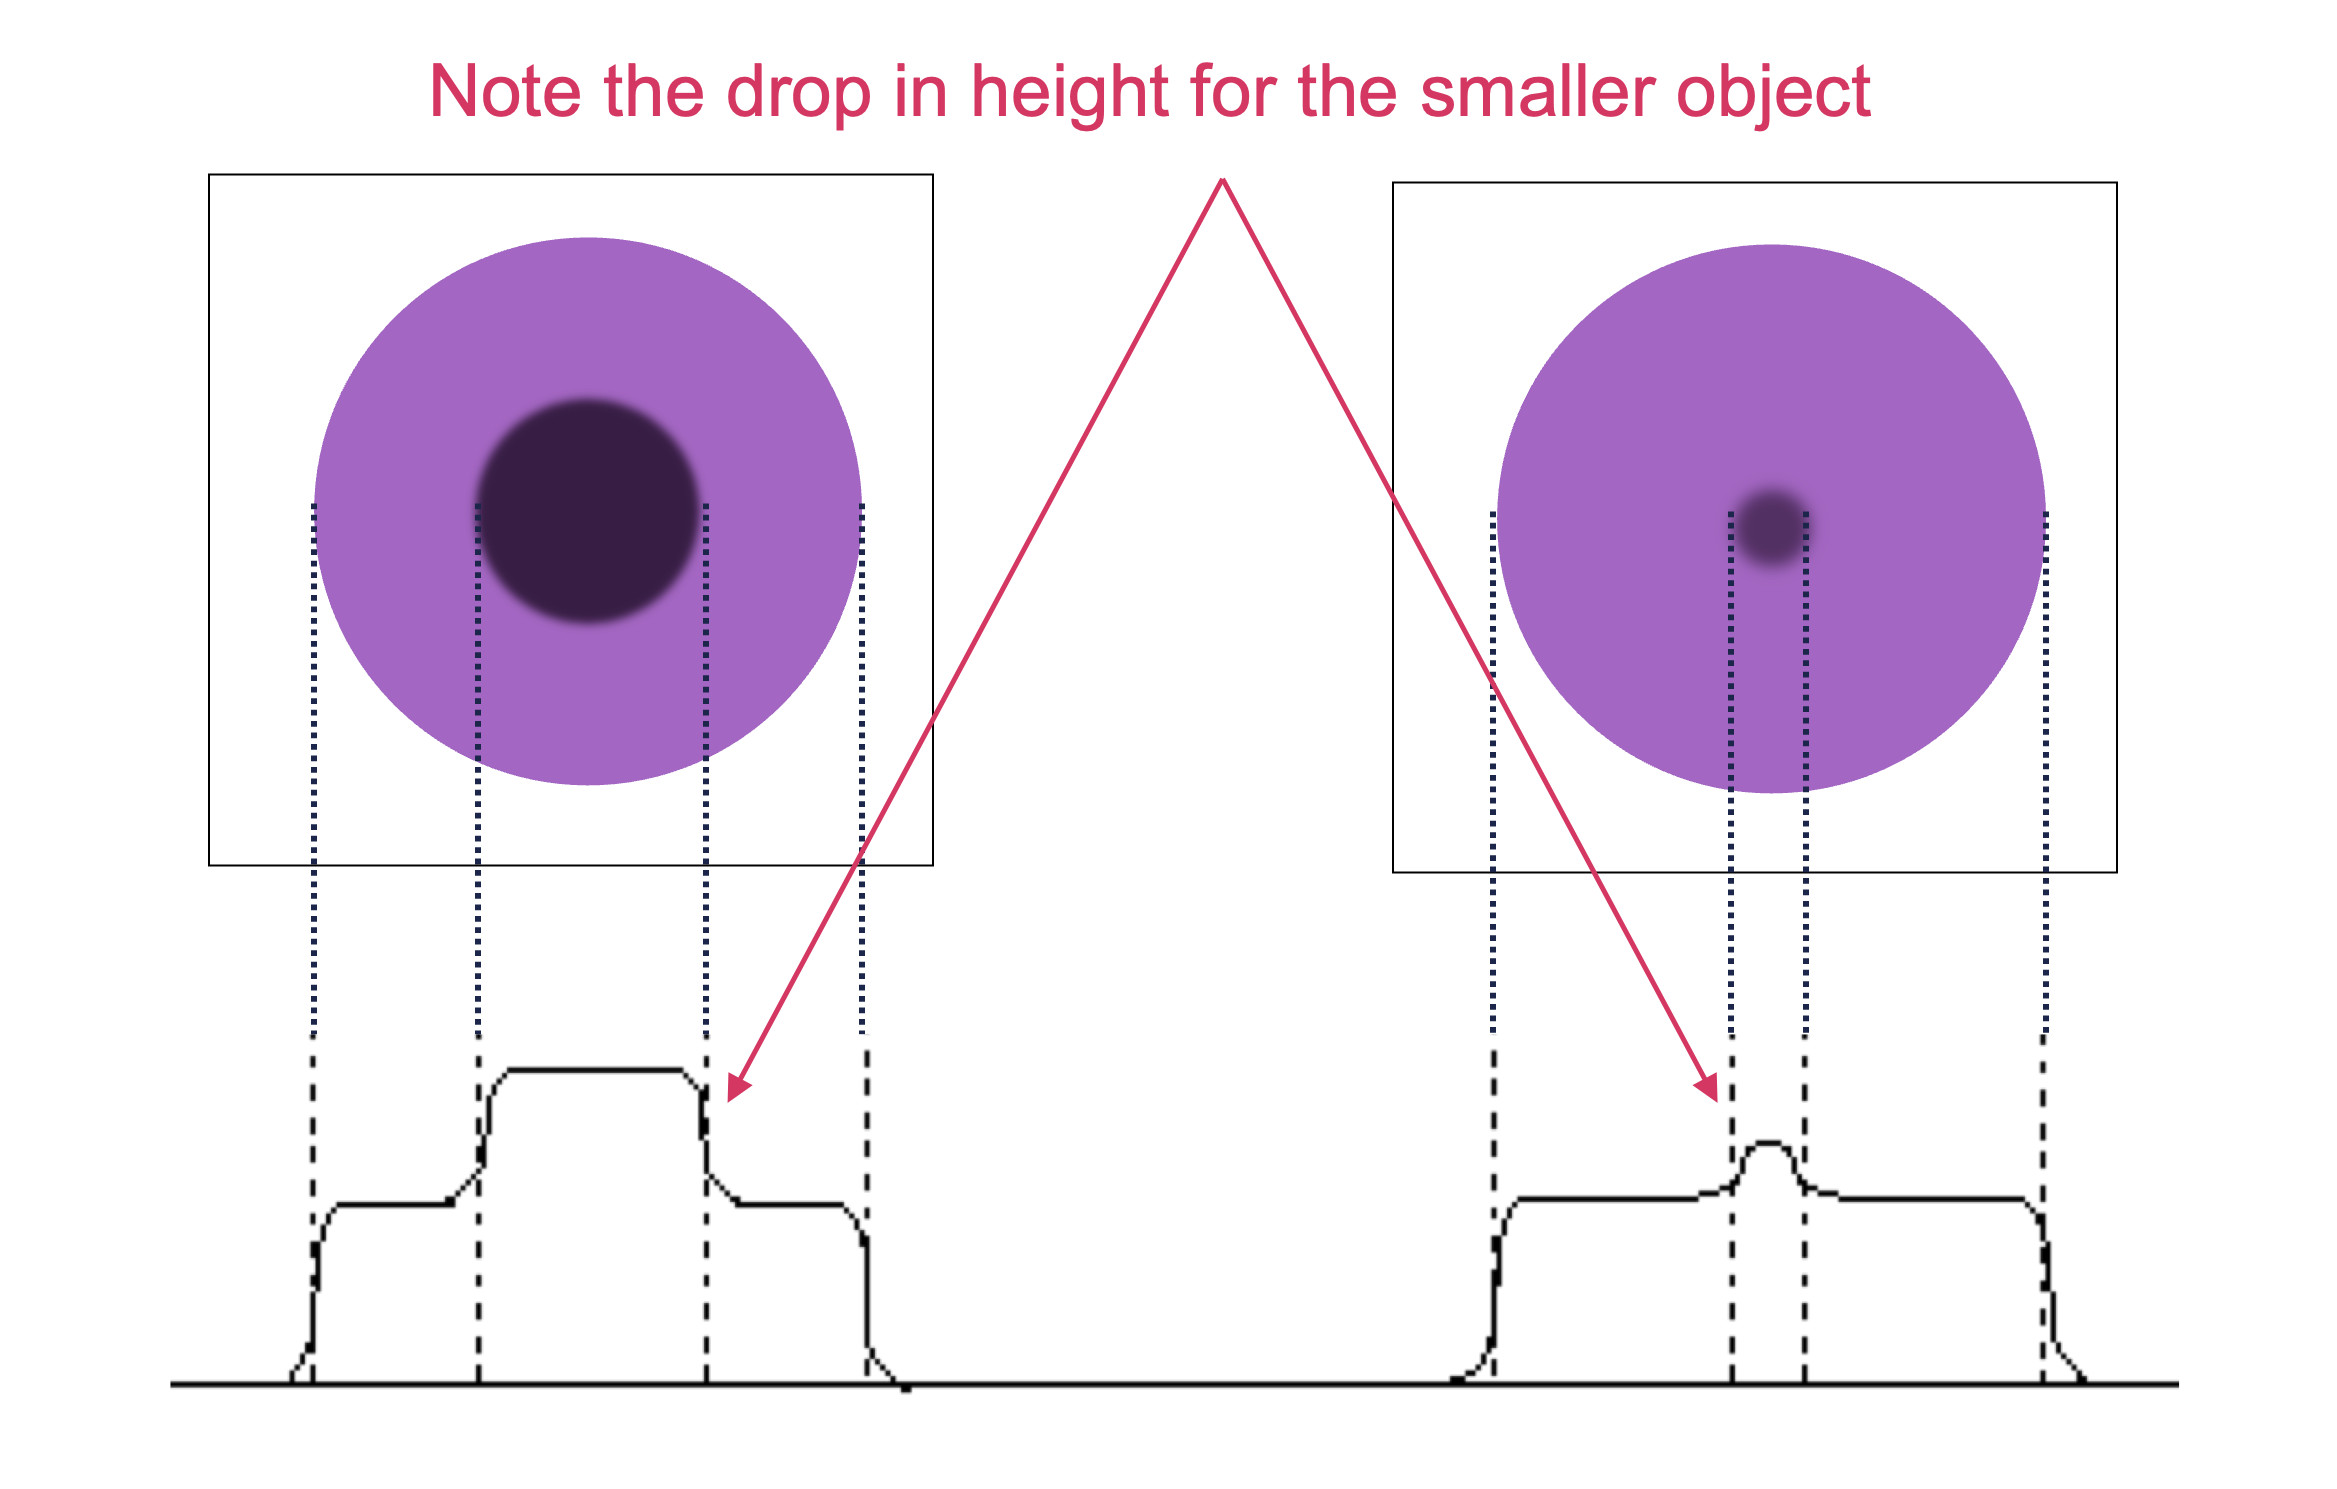
For all lesion sizes, contrast is often reduced by scatter in the patient (and other materials). The scatter gives rise to a broad, uniform (almost flat) scatter background, which is added to the image of primary (unscattered) photons. This is perhaps the most significant source of contrast reduction in many imaging modalities.
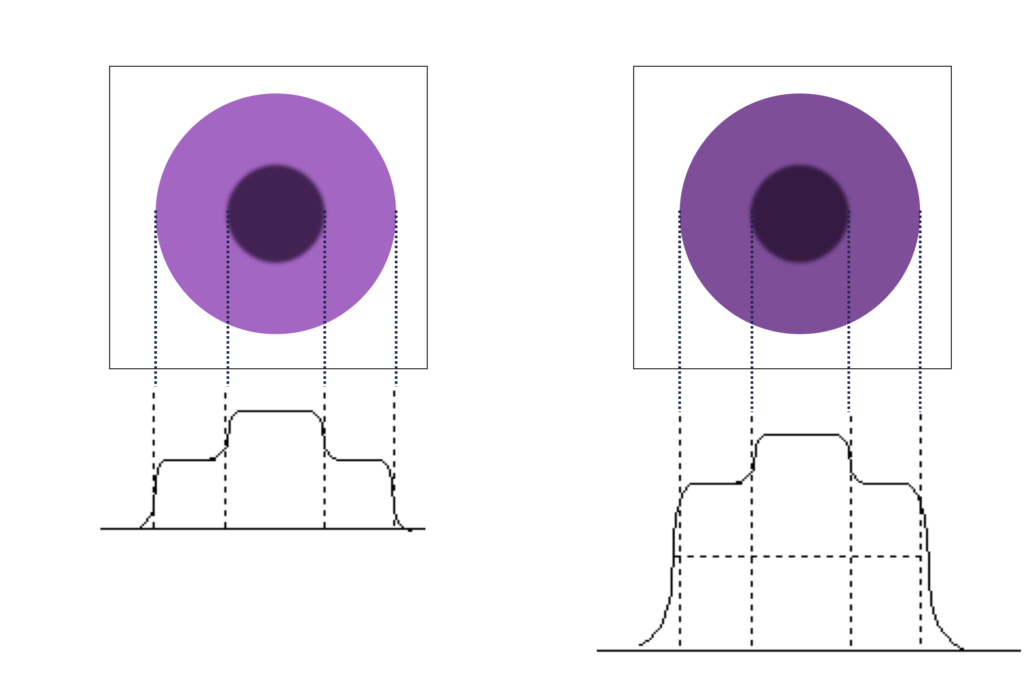
Question: if the object value is 6k counts and the background is 4k counts, what is the contrast? What happens if 1k counts are added to the whole image?
C = (D1-D2)/D2 = (6-4)/4 = 0.5With an additional 1k counts:
C = (7-5)/5 = 0.4.
Note how adding counts to both signal and background reduced contrast. This effect is why it is important to remove scatter counts.

Artifacts
Artifacts create false structures that can interfere with the interpretation and quantitation of the image. Each imaging modality has its own particular common artifacts, usually due to hardware defects, external factors, or reconstruction.
Filters
Filters are software algorithms that can alter the appearance of an image. They are typically used to enhance of remove certain parts of the sign, such as accentuating details or reducing noise. Some filters change the underlying image (the information stored in the pixels), while others are for display purposes only.
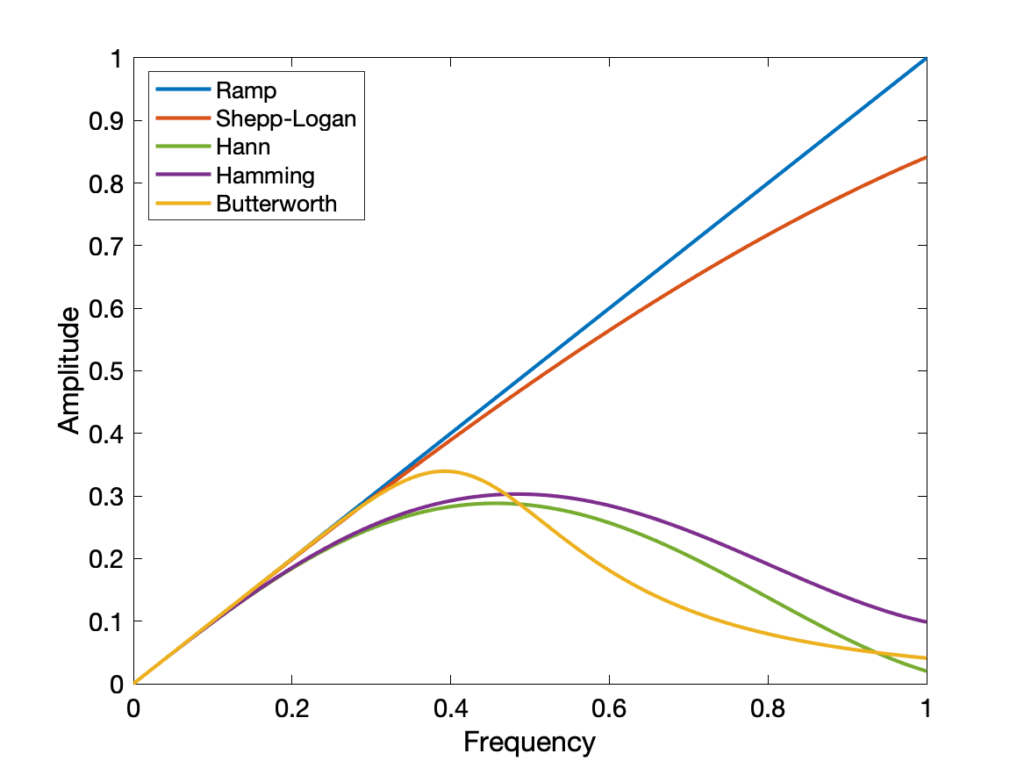
The three main types of filters used in medical imaging a high-pass, low-pass and band-pass. High/low pass refers to which spatial frequencies pass through and are retained. Low spatial frequency corresponds to large objects and high spatial frequency corresponds to small objects, edges, noise. Low pass filters allow low frequencies to remain and large structures maintained. They result in images with lower noise, but also worse resolution (blurring/smoothing). High pass allow high frequencies to remain and small structures and edges are enhanced. This produces a sharpening effect, but also adds more noise. Which filter, if either, depends on the clinical task. For instance, in bone imaging, high-pass filters are often used to enhance edges, while in soft tissue imaging, a low-pass filter might be applied to reduce noise. Band-pass filters remove both very high and very low frequencies.
In addition to the general type of filter, different functions and settings are used to optimize the filtering. A few types include:
- Gaussian
- Ramp
- Hann
- Shepp-Logan
- Butterworth
- Hamming
Most filters have a cutoff value beyond which frequencies are not included. Higher cutoffs result in crisper but noisier images.
Gaussian filters are popular for smoothing images, while the others are used in 3D image reconstruction.
Image reconstruction
Many medical imaging modalities employ 3D techniques so that it is possible to view internal structures without the overlapping effects seen in planar images (e.g. X-rays, scintigraphy). Reconstruction is used to convert multiple 1D or 2D images in 2D or 3D images. The following applies to photon imaging (CT/PET/SPECT). MRI reconstruction is covered on the MRI page.
Detectors will collect intensities based on photons that are transmitted or emitted from a patient. By collecting those intensities from multiple angles around the patient, it is possible to disentangle the information and create a single 3D dataset. Most photon detectors store or put data into 2D pseudoimages known as sinograms. Each line of the sinogram represents one intensity projection from a particular angle. They are called sinograms because an off-center point object traces a sinusoidal path. Radon transforms are use to move between sinogram and image space.
Filtered back projection (FBP)
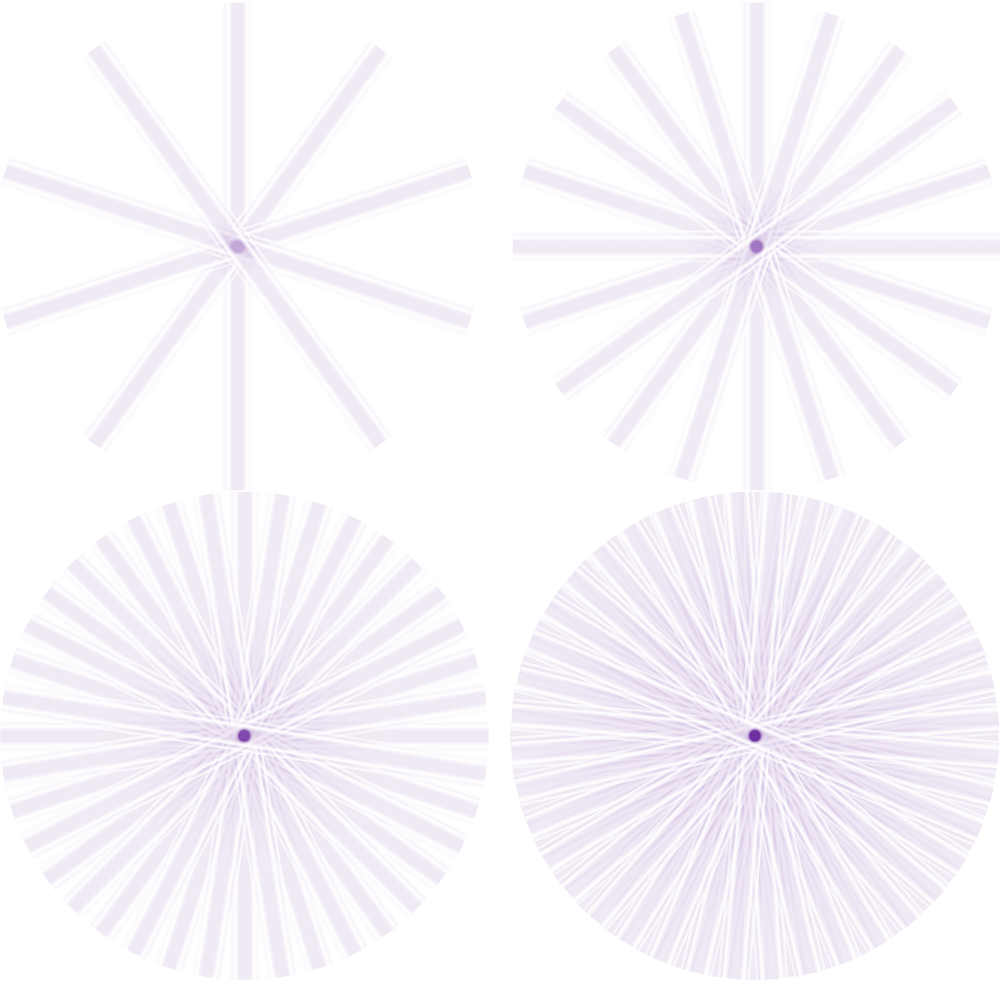
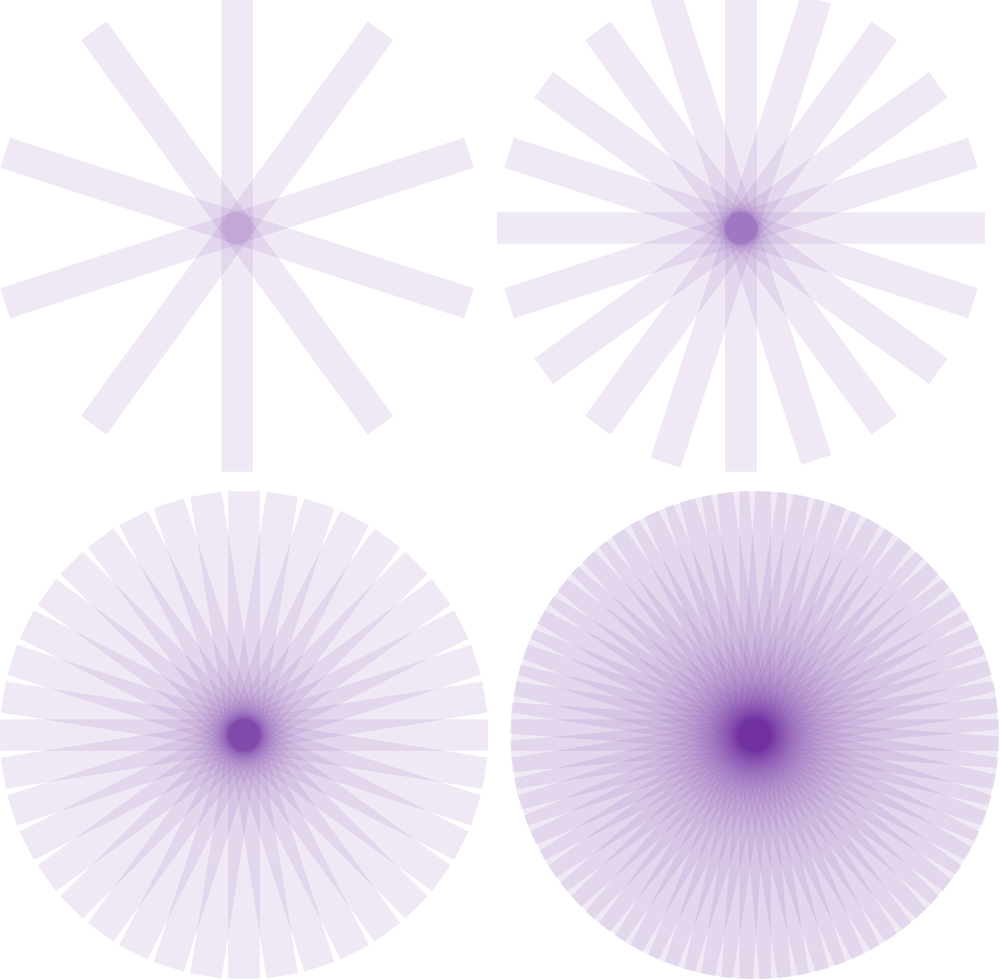
Sinograms are the forward projection of an image, and thus when recreating an image from singorams, we must backproject. However, if we backproject a raw sinogram we will end up with very blurry images.
Kesner’s Medical Physics website has an amazing set of gifs to illustrate how reconstruction works
Iterative
An improvement upon FBP is an iterative approach to reconstructing an image. It is more complicated and computationally slower, but it can produce better results. It is also easier to incorporate other corrections during reconstruction. Iterative reconstructions are more likely to be used in molecular imaging than in CT, because of those modalities have fewer photons and need more sophisticated techniques to produce quality images. The basic workflow is shown below:
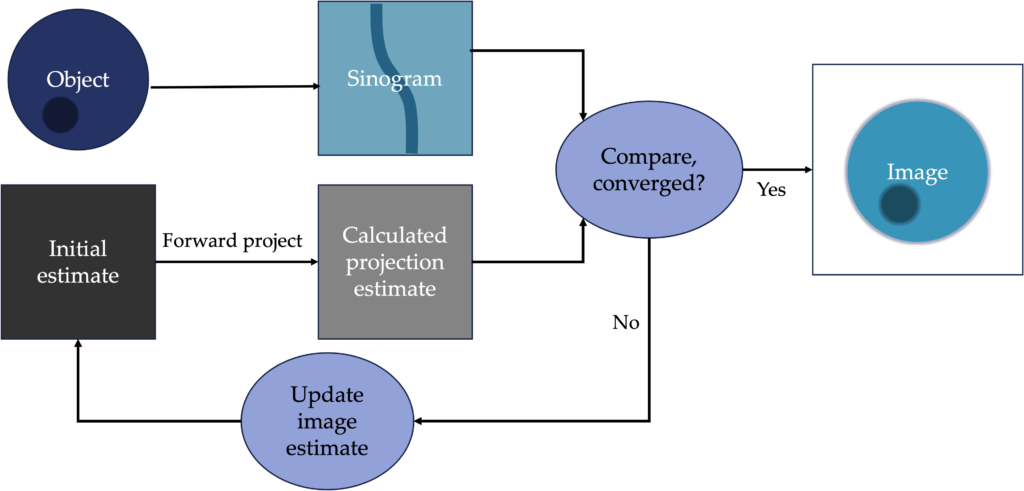
Common types of iterative reconstruction are Maximum-likelihood, expectation maximization (MLEM), Ordered subset, expectation maximum (OSEM).
DICOM and PACS
Medical images must be stored for future use. Radiologists often refer to previous imaging to aid in their diagnoses. It is also important for the images to hold as much relevant information as possible, and be viewable across platforms. Digital Imaging and Communications in Medicine (DICOM) is the most common image and communications format. It is a standard by which medical equipment stores and transmits medical imaging and associated meta data. Meta data includes fields such as patient name and ID, exam date, imaging parameters, and more. Every imaging system has a unique ID within the DICOM system, as does every single exam, study, and image. This system allows for organization of images and connection of imaging information to a patient’s electronic medical record.
- Study Instance UID: Assigned to each medical imaging study and groups together all the images that were taken during that study.
- Series Instance UID: Assigned to each series of images within a study. For example, if a patient has both lateral and AP x-rays, those would each have their own series instant UID
- SOP Instance UID: Assigned to each individual image within a series, such as a single slice within a 3D CT image set. It ensures that each image is uniquely identified and can be accessed and interpreted correctly.
Many, but not all, systems have embraced this standard (it is not required). DICOM provides image format, as well as a communications protocol over TCP/IP network for sending and receiving images. Images must be reliably transferred to the medical center’s Picture Archiving and Communication System (PACS) where they are stored and can be accessed from various computer consoles. DICOM viewers can be used by radiologists and other medical professionals to view, manipulate and analyze images.

