- Tomography/3D imaging
- Instrumentation
- Acquisition mechanics
- Image reconstruction, units
- Image quality
- Radiation dose in CT
- Clinical applications
- Specialized techniques
- DECT, 4D CT, CBCT
- Specialized techniques
Tomography/3D imaging
“Tomos” means cut, cutting, slice, section, while tomography refers to a device/method to create an image where the object is visualized by “cutting” into sections. A tomogram is the image that is created. Computed Tomography (CT) almost always refers to x-ray computed tomography, although other types (PET/SPECT) also exist. Instead of a single x-ray from a single direction, multiple x-rays from many different angles around the patient are taken. Images are typically produced through reconstruction from the multiple projections. Reconstructed images don’t have overlapping structures like planar x-rays, which has the main advantage of improving contrast.
To quantitatively illustrate the improved contrast for 3D images, below is shown a grid representing an extremely simple CT slice, with just 9 voxels. The center voxel has a value of 20, and the surrounding voxels have a value of 10. The contrast of the slice is (20-10)/10 = 1.0. If we were to instead take a single projection from this slice, we would get a column of values 30, 40, 30 (summation of rows). The contrast of the projection is only (40-30)/30 = 0.33.
| 10 | 10 | 10 | 30 |
| 10 | 20 | 10 | 40 |
| 10 | 10 | 10 | 30 |
| 30 | 40 | 30 |
Imaging planes
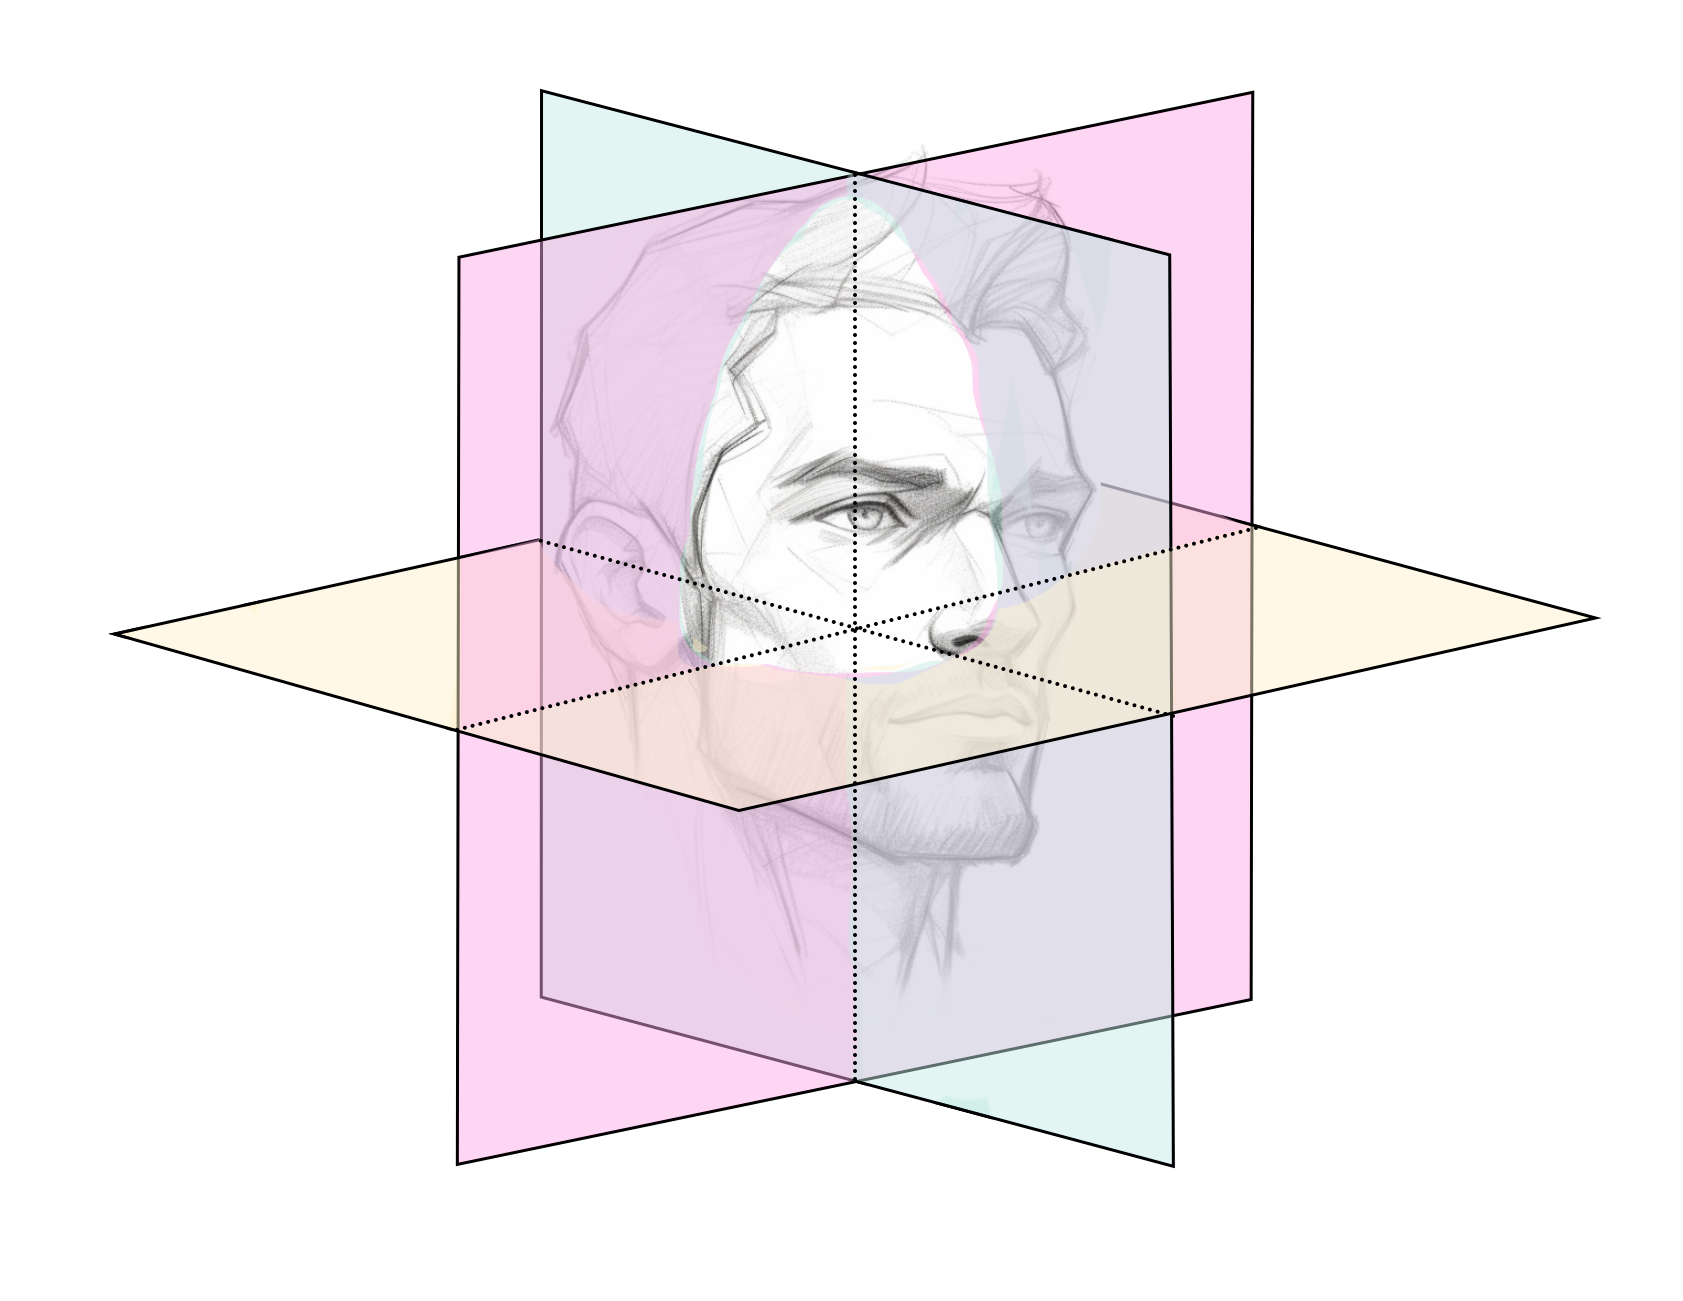
Because we now have 3D images, it is important to define imaging planes since we still view images in 2D slices.
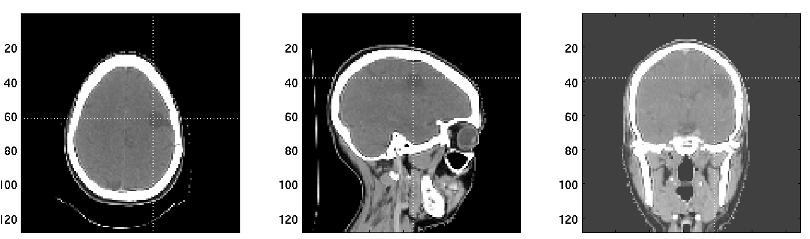
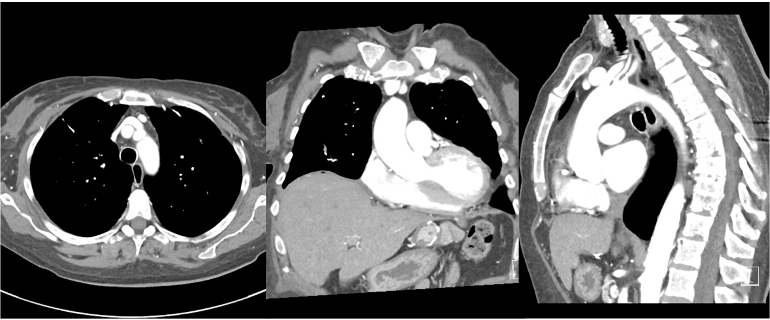
The canonical orientations are axial/transverse, coronal, and sagittal.
Axial/transverse: cross-sections of the body, horizontal slices looking up from the feet. This is the most common view for CT images, although others are also used.
Coronal: view facing the subject.
Sagittal: view from the side of the subject
Instrumentation
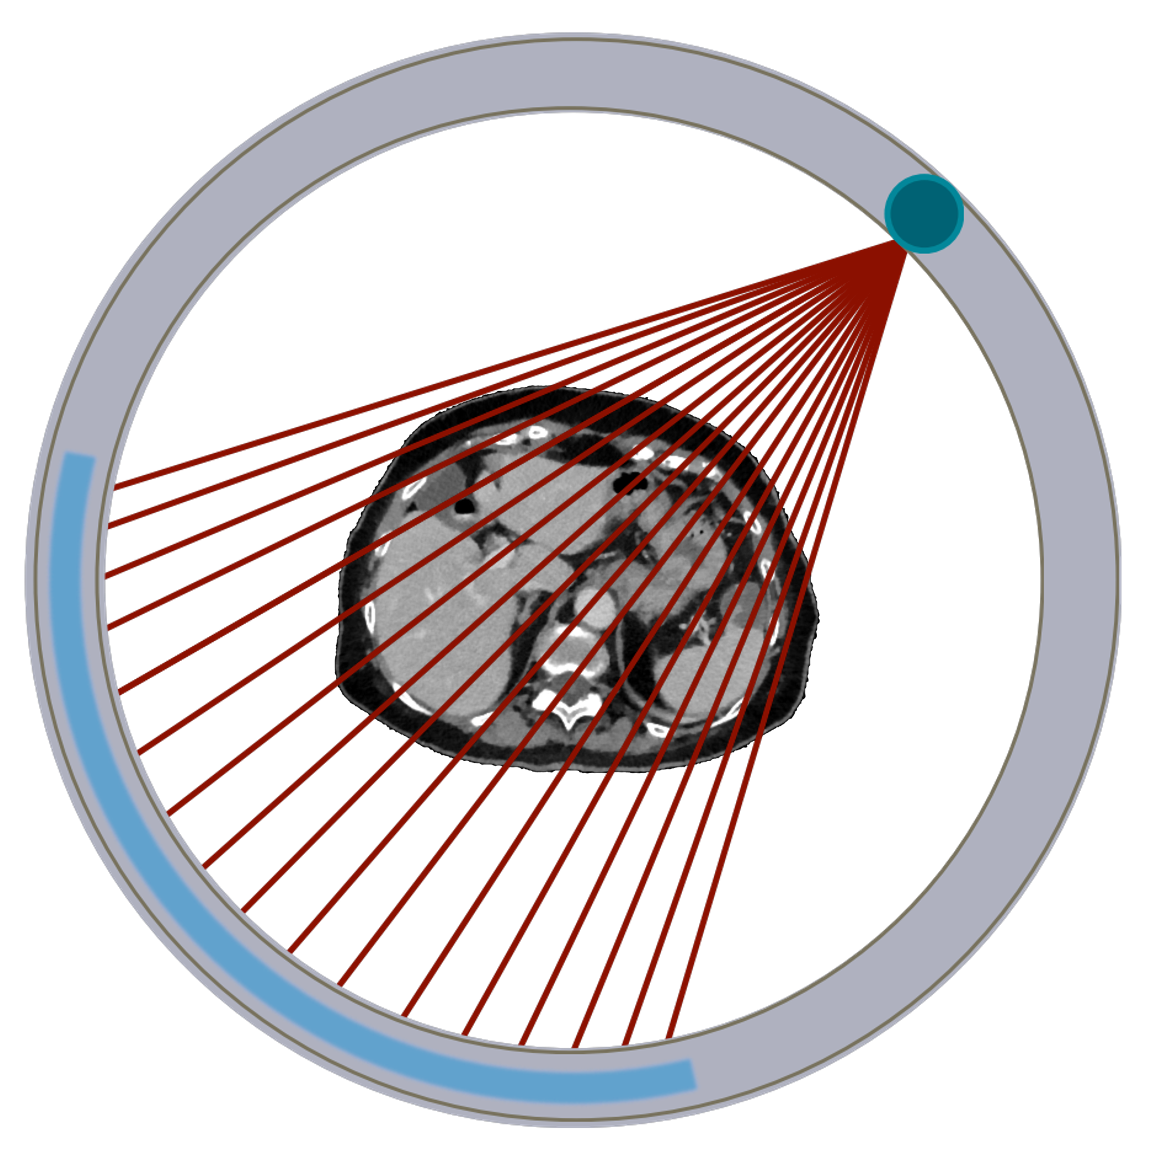
In the past, CT scans were called CAT scans for “computed axial tomography” since axial slices were acquired at multiple locations. Since moving away from strictly “axial” imaging, the “A” has been dropped. CT scans consist of a narrow fan-shaped beam of X-rays. Those X-rays are directed into a subject, and some pass through to the opposite side and strike a detector, which can then form an image. The source and detector rotate around the subject to acquire projections in ‘every’ direction. These projections are reconstructed into a 3D image.
The X-ray tube and detectors are aligned opposite each other so that the geometry is fixed as they rotate around the patient. This is important when reconstructing the 3D image from projections. The detector is curved to match the curve of the circular motion within the bore. The X-rays are collimated to the desired thickness and fan-angle width, which is usually around 60 degrees. One rotation of the system will result in a single axial slice of the patient. The width of this slice depends on the width of the detectors and the collimation used. The patient is moved through the circular aperture (“bore”) while the gantry spins 360°, sending x-rays through the subject to detectors. By moving the patient through the bore, it is possible to get multiple slices that can then be stacked into a 3D image. Typical bore sizes are 65-80 cm, sometimes larger for radiation therapy applications. For CT systems used to plan radiation therapy, gantries can be tipped up to 30° to allow for non-axial imaging and achieve the desired setup.
X-ray tube
The X-ray tubes used in CT scanners operate with the same principles as those for planar imaging. They typically have large and small focal spots and a rotating anode to dissipate heat. The heat loading is extra important in CT imaging because so many images are taken in a row – the tube may need to run continuously for minutes in some applications. The main settings for the X-ray tube are kVp and mAs.
Collimation and compensation
Pre-patient collimation limits the field-of-view using lead or tungsten blocks. Like with planar X-rays, collimation is useful for reducing dose and improving image quality by limiting scatter radiation. Collimators limit the beam to the total size of the detector array. For systems with a single detector row, collimation determines the slice thickness. For systems with multiple rows/slices, the thickness is determined by the detector and reconstruction options.
Post-patient collimation further reduces scatter radiation by placing septa between detector elements. These septa stop large angle scattering and help improve contrast. This is similar to the anti-scatter grid used in planar x-ray. The septa can be 1-D (rows) or 2-D (grid).
Compensating filters are used between the tube and the patient to account for the typical patient shape. A bow-tie filter is used to reduce beam intensity on the periphery of the beam, where the body is thinner, and more photons are able to pass through. The edges of the filter are thicker than the center to stop more photons at the edges. Filters are typically made of metal (e.g., aluminum, copper) and plastic (lightweight and easy to shape).
These filters also partly correct for beam hardening, where the energy spectrum of X-rays changes with thickness. Lower energies are preferentially absorbed as a multi-energy beam passes through a material, such that a higher proportion of higher-energy photons pass through. Additionally, by filtering some of the unnecessary X-rays, these filters also reduce dose to the patient.
Detectors
Geometry
CT scanners were originally designed with one row of detectors, but most modern scanners have multiple detector rows (MDCT) – anywhere from 16 to 320! With multiple rows, it is possible to acquire several slices during each gantry rotation, and it reduces demands on the X-ray tube.
Materials
CT detectors are solid-state scintillators and have high x-ray detection efficiency. They use a crystal that emits light when struck by the x-rays from the x-ray tube. Scintillation crystals (Gd2S2O, CsI, and other materials as well) are sintered to increase physical density and light output.
Sintering is when scintillation powder is converted into high-density ceramic using heat. The high density helps with detection efficiency. These crystals are scored to create individual detector elements. A photodiode is connected to the scintillator to convert light photons to electronic voltage, which can then be processed into image intensities. The size of the detector elements is one aspect that contributes to the resolution of the system.
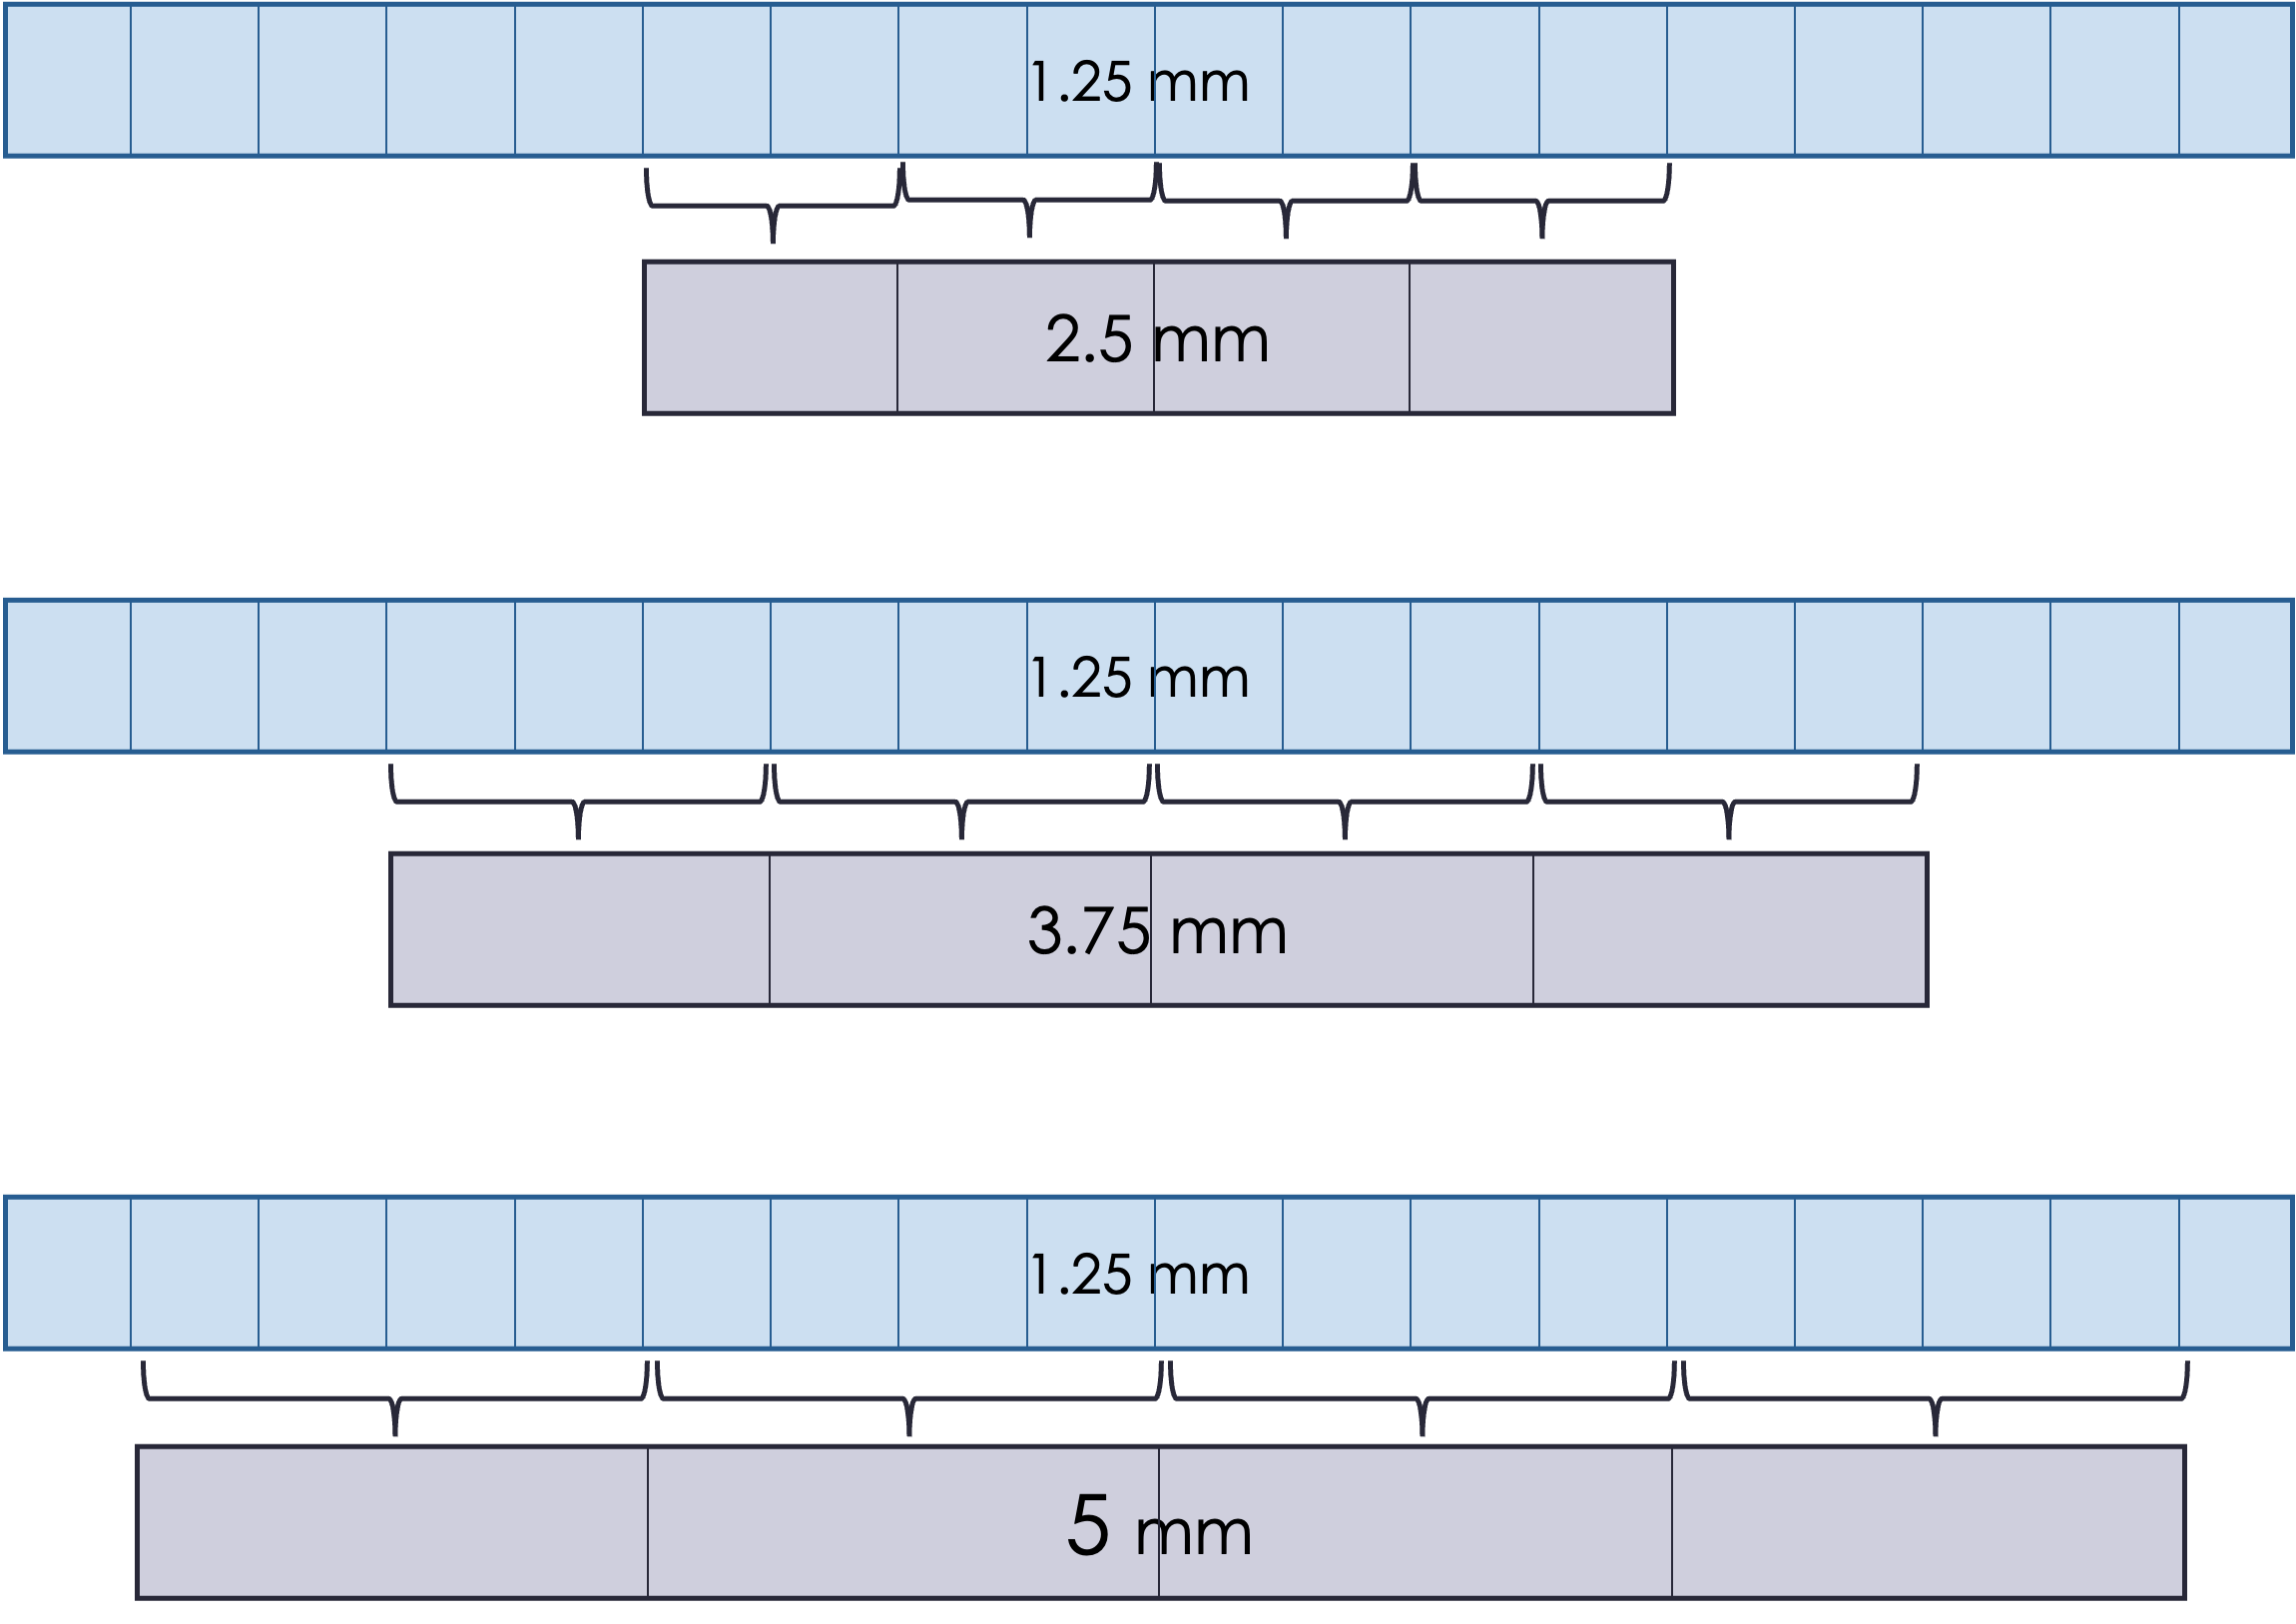
These detector arrays are curved to match the x-ray beam and the rotation within the bore and typically cover around a 60° angle. They are divided into modules to allow for easier repair if a detector element malfunctions. Each module has processing electronics to amplify and refine the signal, and an ADC to store data as digital bits. Final processing is done on the computer to form images.
The detector size determines the minimum slice thickness, which is typically 0.5 to 1.25 mm. It is possible to group elements to create thicker slices. This is typically done at the reconstruction stage.
What is the consequence of thicker slices? Think about SNR and spatial resolution
Thicker slices mean better SNR because there is more data in every slice (higher N). However, the spatial resolution is worse because more information is being averaged and fine details become blurred.
Another consequence is that thicker slices can mean a reduced radiation dose. More photons are contributing to each slice, so fewer photons are needed overall to maintain the same SNR. It can also be quicker to acquire, which is important if the patient may have trouble staying still (pediatric, breath-hold, trauma, etc.).
It is also quicker to read the slices, or create contours for radiation therapy, if there are fewer slices covering the area of interest. The choice of slice thickness depends on the clinical situation.
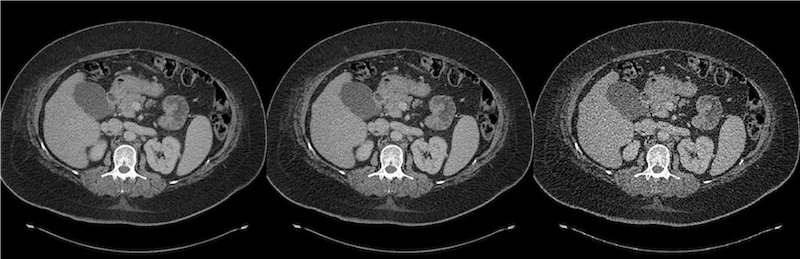
An example of the effect of different slice thickness in the abdomen is shown below. The 5 mm slices are less noisy but have worse resolution than 1 mm slice thicknesses. There is usually a “sweet spot” that balances SNR and resolution, but it depends on the clinical task and the anatomy imaged.
Acquisition mechanics
An important aspect of CT scanning is the scanner rotation and bed motion. Because CT is a 3D imaging modality, multiple slices must be acquired. Detector arrays as wide as a patient are prohibitively expensive, so instead the patient bed changes position so that the full axial extent desired may be imaged with a detector array that may be only 20 – 40 mm wide.
To acquire the multiple projections needed to reconstruct a 3D image, the tube and detector must rotate around the gantry. Since a high voltage is needed constantly to produce X-rays and collect signals from the detectors, the system uses a slip ring assembly, where brushes maintain contact with the rings during the rotation. Most CT scanners can do up to 5 rotations per second, which results in high angular velocities and large g-forces. As such, the system needs to be carefully engineered and balanced to maintain these speeds safely. The x-ray tube must also be aligned with the axis of the scanner so that the cathode-anode runs parallel to the z-axis. This configuration also allows for the wide (~ 60°) angle of the fan beam. A CT scanner can take 1000 – 3000 projections in a single 0.5-second rotation.
Axial
Originally, CT scanners used an axial motion to collect multiple slices (hence the original name computed axial tomography, “CAT”, scan). In this setup, the gantry rotates around the patient, the bed moves to the next position, the gantry rotates again, and so on until the full axial extent desired has been imaged (e.g., 30 cm to cover the lungs). This process is somewhat slow, and the total time depends on the beam width and length to be scanned.

Helical/Spiral
More commonly, modern CT scanners use a helical motion to acquire images. In this setup, the bed moves continuously while the tube-detector system rotates. This process results in faster imaging and greater dose control. The helical pitch determines the effective slice thickness and dose. Pitch is the distance the bed moves during one beam rotation, divided by the beam collimation. For overlapping motion, pitch is less than 1. Contiguous motion has pitch equal to one, and extended motion has pitch greater than 1. The dose is roughly proportional to 1/pitch, such that higher pitches result in lower dose (less overlap). The final image slices are still axial and are reconstructed by averaging CT projections taken 180 degrees apart.
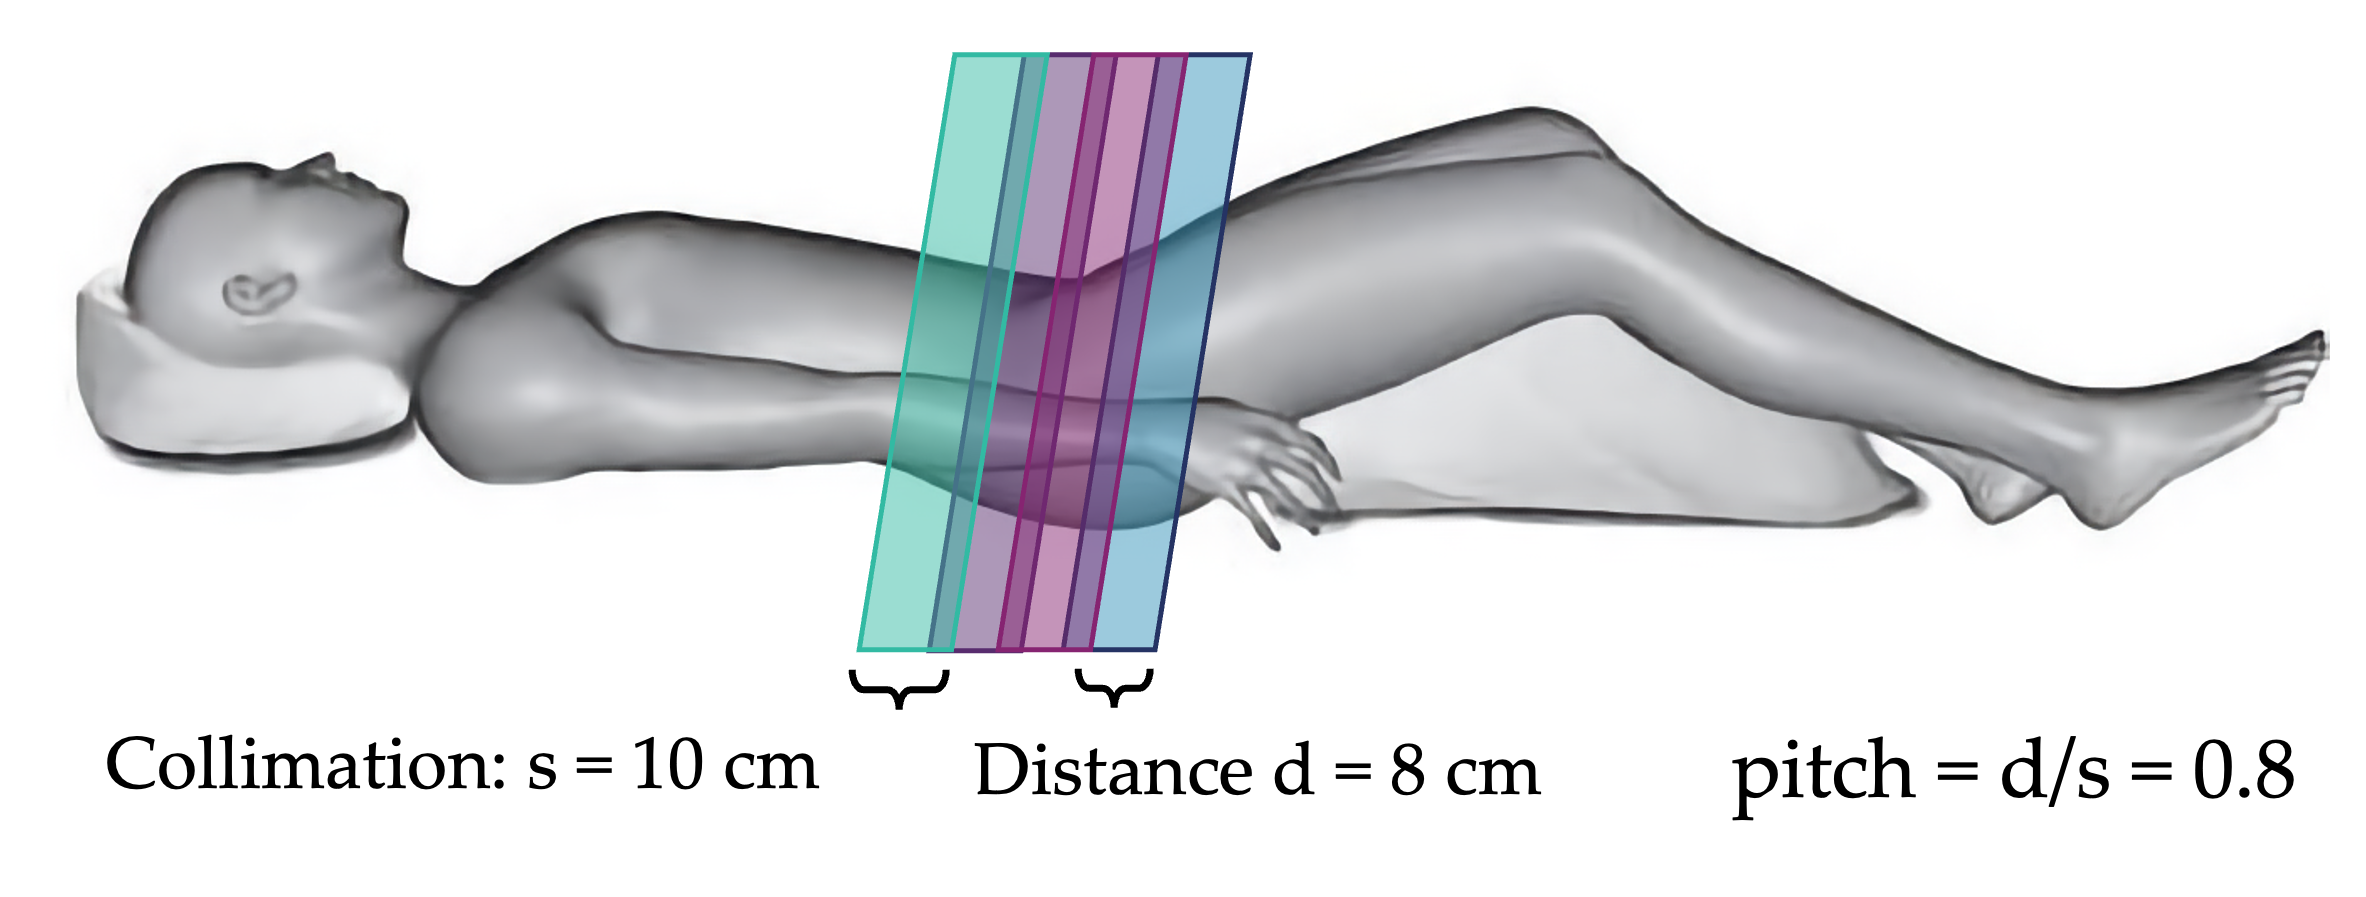 Helical pitch 0.8
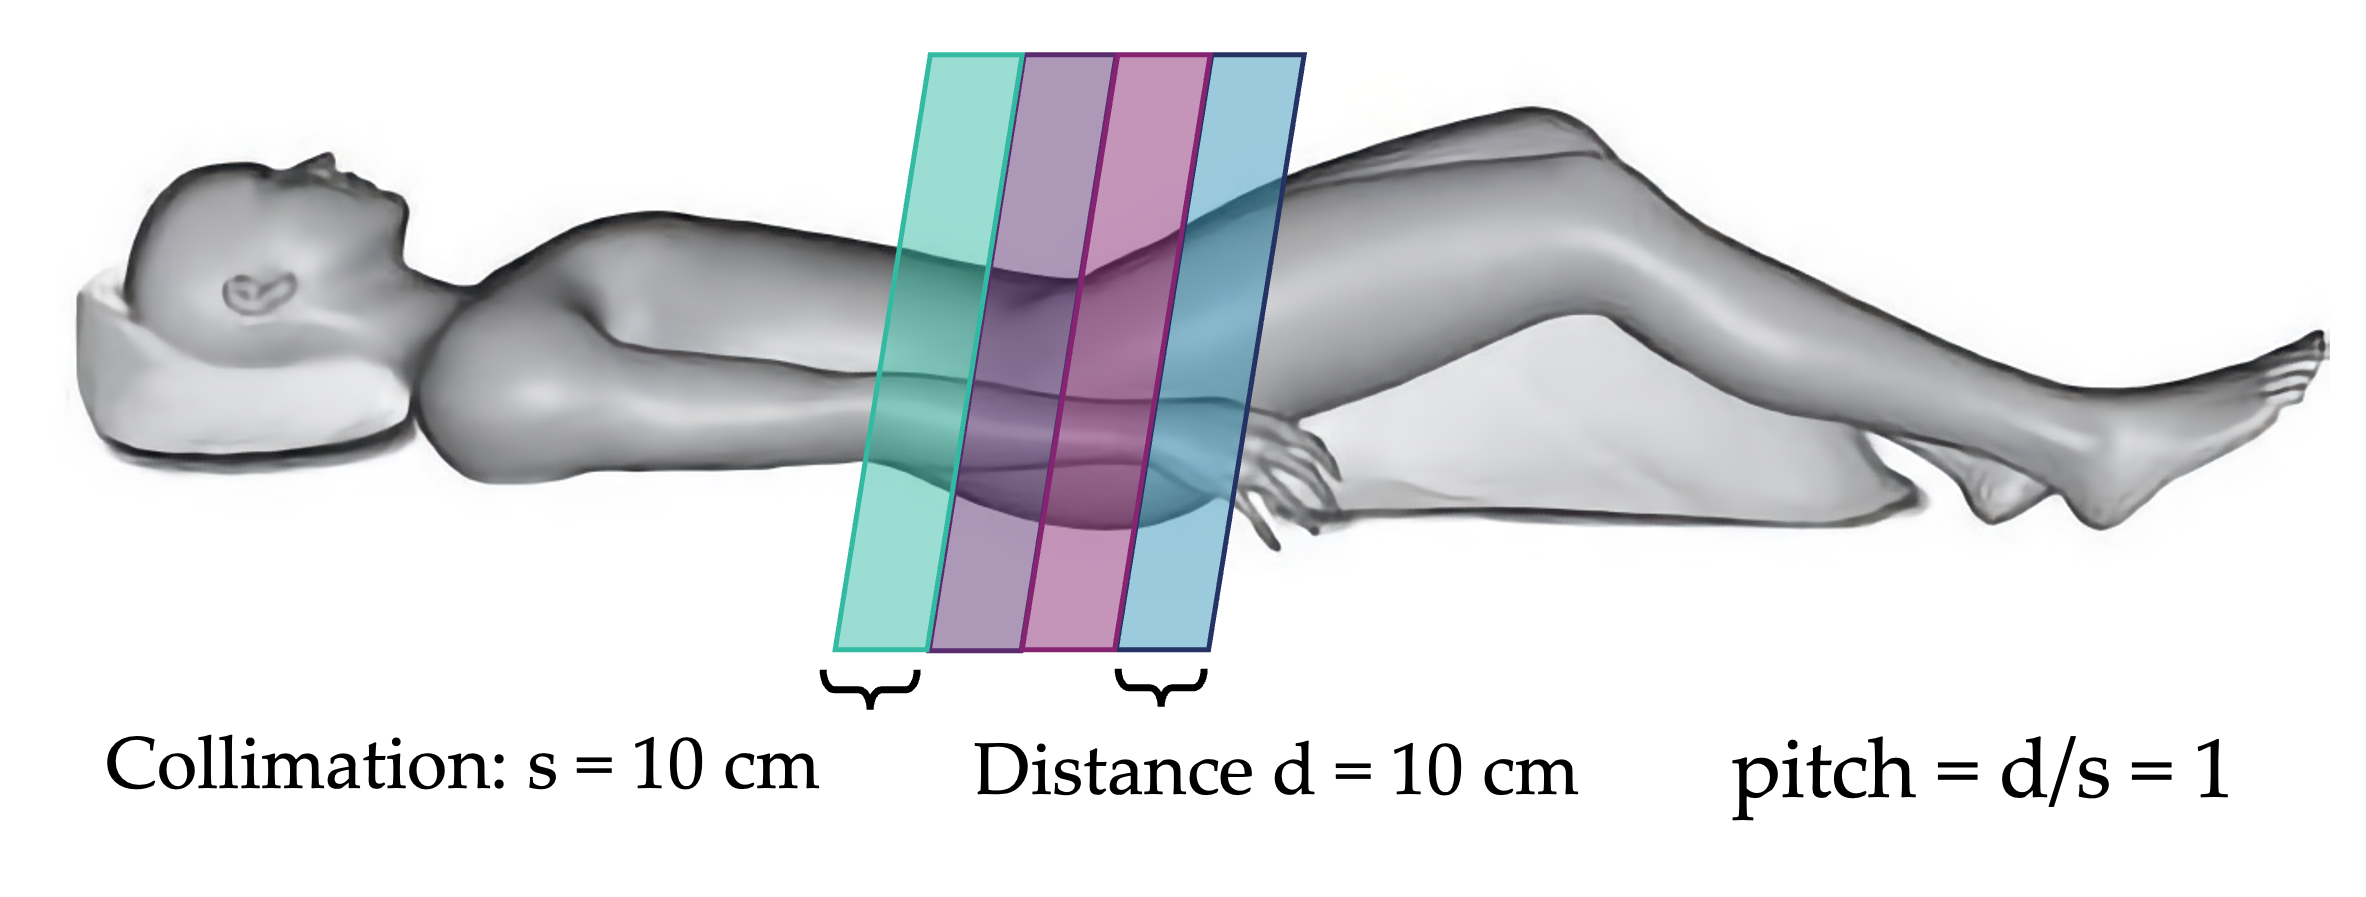
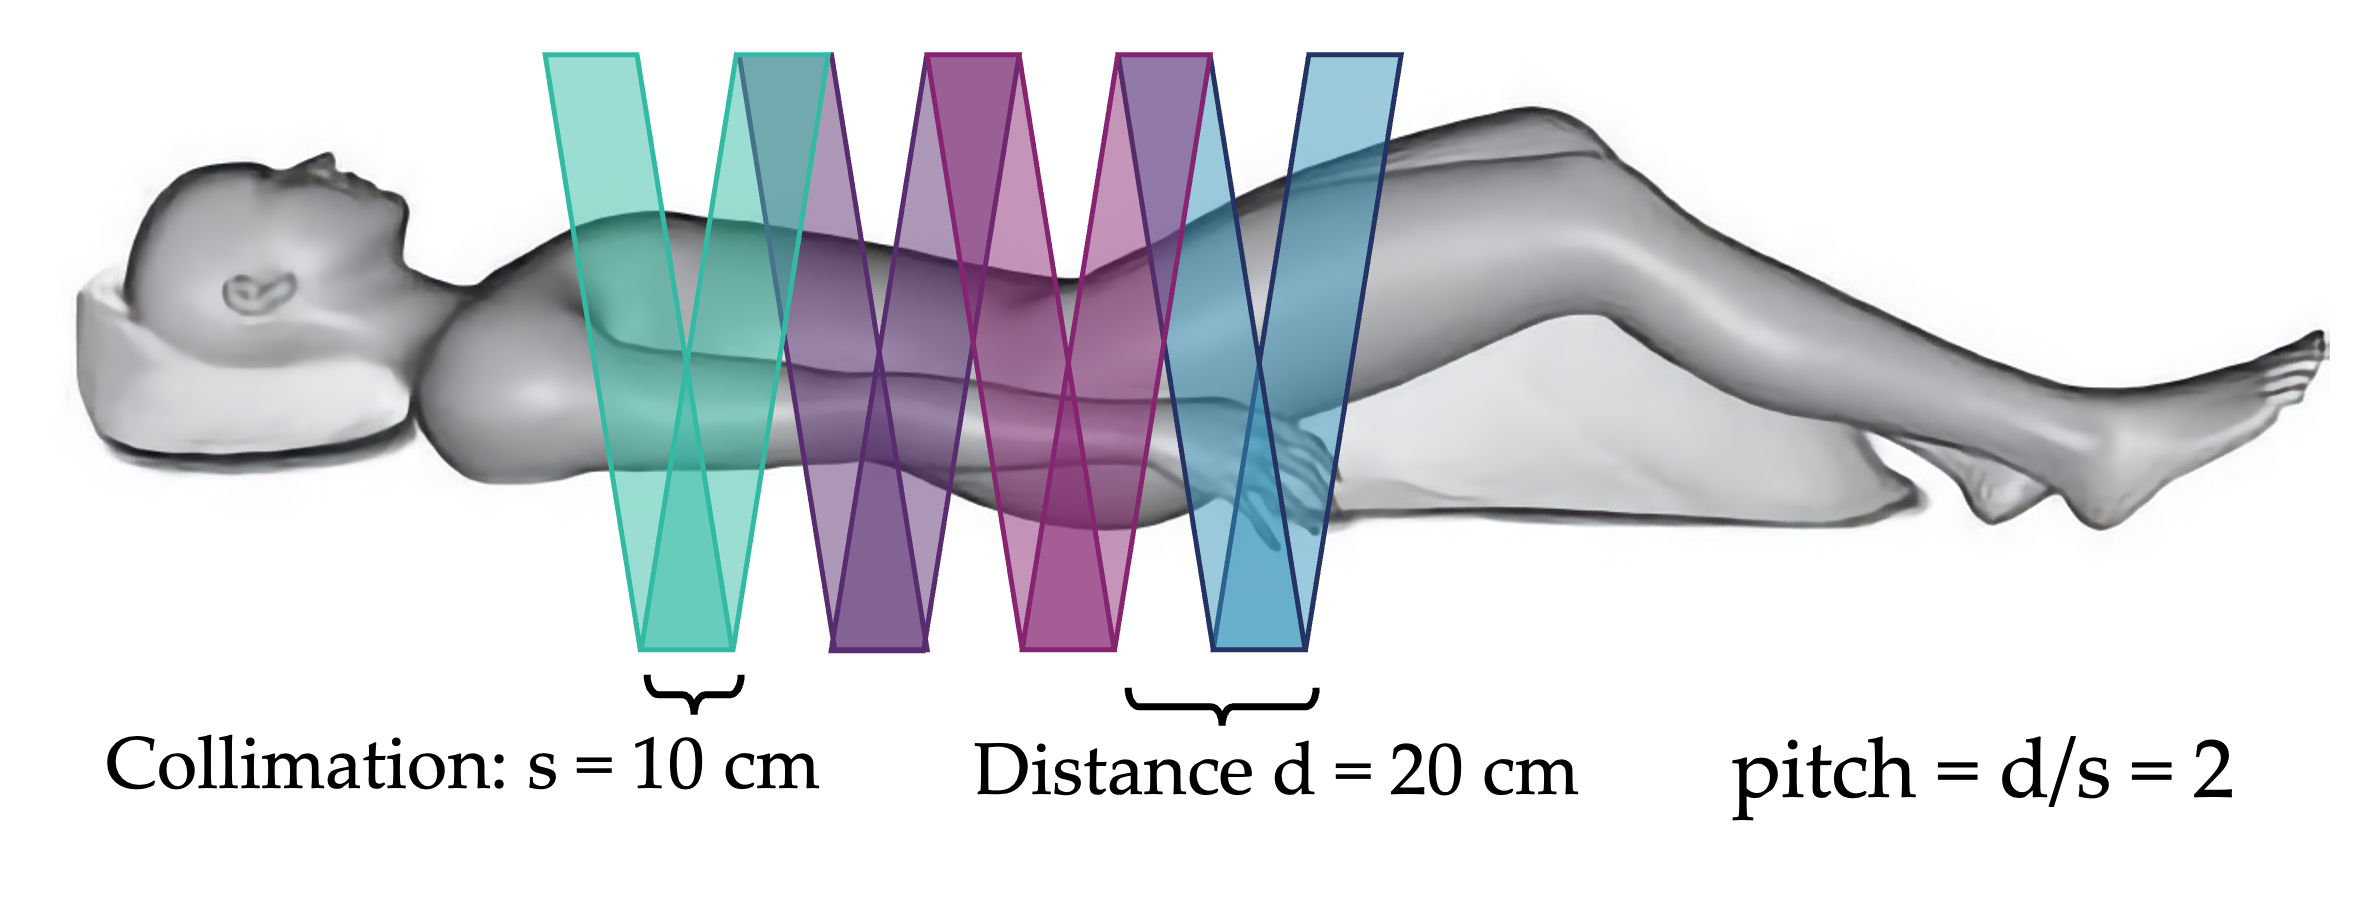
Question: if collimation is 10 cm and bed moves 20 cm per rotation, what is the pitch?
pitch = bed motion / collimation = 20 cm / 10 cm = 2 (extended)
Couch/bed properties
For best image quality (and comfort), scanners use a curved couch because it matches the geometry of CT detector arrays. However, Radiation Oncology uses a flat couch top to match the linac treatment couch, since treatment planning CTs must be taken with the exact same setup as treatments will have. The result of this is slightly worse spatial resolution and contrast.
Beds are made of carbon fiber to minimize X-ray attenuation (which otherwise reduces the number of photons reaching the detector and affects SNR). The bed can move up and down to help center the patient, and it moves the patient in/out of the gantry. Bed motion can be manual during setup, and is automated (very precisely) during scanning. Beds do not move side-to-side; they stay centered in the gantry bore. The couch has a weight limit, usually 400 or 500 lbs. It is important not to exceed the weight limit, as it can cause the couch top to sag, positioning to be off, and put a strain on the mechanical motion system.
Projection Radiographs
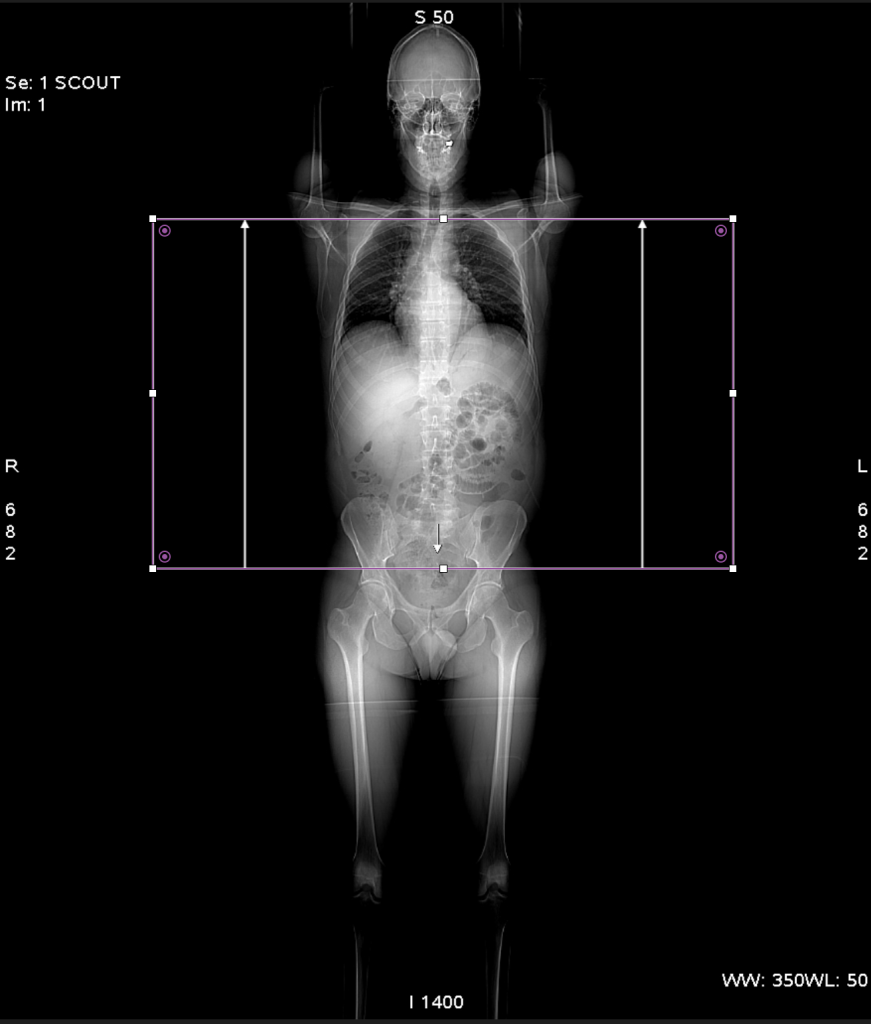
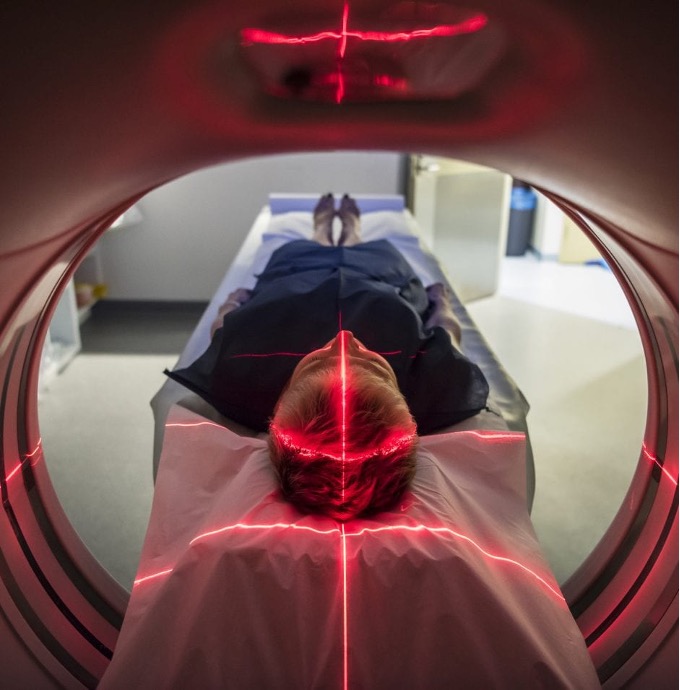
While laser lights in the scanner bore can give a good idea of the centering of the patient and the axial range to scan, 2D imaging is often done before the full 3D CT scan. One or two projection scans are taken to verify positioning and define the axial extent of imaging. The x-ray tube is placed either at the top of the gantry for an anterior-posterior view, or at the side for a lateral view. With the tube in a fixed position, the bed moves through the scanner for a predefined length and creates a projection image over the distance moved. These initial scans often have different names for different manufacturers and can be referred to as scout scans, topograms, projections, scanograms, or localizers. After these scans, a dialog comes up for the technologist to adjust the axial range to include the desired anatomy.
Image reconstruction
CT coordinates are typically as follows: Z from superior to inferior (head to feet), X from right to left (patient orientation), and Y from posterior to anterior (patient orientation). Images are typically displayed in transverse/axial, sagittal, and coronal views. Transverse are in the XY plane, coronal in the XZ plane, and sagittal in the YZ plane. Transverse are cross sections of the body looking up from the feet, coronal are shown as if facing the patient, and sagittal are from the side of the patient. See imaging planes.
The many projection images are put into sinogram format as they are acquired. The sinograms are a map of the intensity (number of photons) seen by the detector at a given angle and distance from the center. The intensity varies with the amount of attenuation of the photon beam passing through each part of the patient. See the section on general image reconstruction for some details. CT typically uses FBP, although there has been more use of iterative reconstruction in recent years, especially with the push for lower doses, which is better handled with iterative reconstruction.
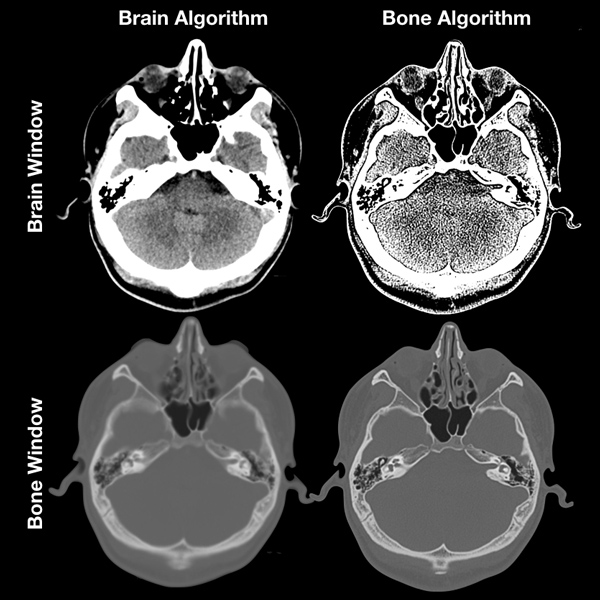
Reconstruction parameters include pixel sizes (typically 0.5 – 1 mm), slice thickness (typically 1.25 to 5 mm), field of view (FOV), filtering, and smoothing. Using the same matrix size, the FOV can be made smaller to achieve smaller pixel sizes. This is especially useful in head and neck imaging, where patients are smaller and more detail is needed. Filtering can be used to improve details (but also increase noise), or add smoothing (fewer details but less noise). CT scanner consoles typically offer several preset filters depending on the anatomy, e.g., standard, soft tissue, lung, chest, bone, detail, edge. They vary in the amount of smoothing/sharpening applied to balance resolution and noise.
Field of View (FOV) is the axial in-plane size of the scanned image — always a circle for CT. The scan FOV (SFOV) includes all anatomy to be included in the scan. The SFOV depends on the configuration of the scanner and is slightly smaller than the bore of the scanner. When larger patients or those needing complicated positioning have anatomy outside the SFOV, artifacts at the edge of the image can occur. The maximum SFOV in CT imaging is typically 65 cm.
The Display FOV (DFOV) can be cropped from the SFOV for better resolution during reconstruction. The resulting pixel size depends on the matrix size (typically 512 × 512) and FOV.
What is the pixel size for a CT scan with a display field-of-view (DFOV) of 50 cm and a reconstruction matrix of 512 x 512 pixels? What if the FOV is 30 cm?
50 cm / 512 = 0.977 mm pixels
30 cm / 512 = 0.58 mm pixels
Hounsfield Units
Pixel values in CT images are given in Hounsfield units (HU). Unlike a projection image, reconstructions aren’t simple intensities or counts. For quantitative information, calibration is required. The HU are a function of the attenuation, \mu, of the pixel, given as the linear X-ray attenuation coefficient relative to water. This attenuation depends on the electron density and physical density of the material being X-rayed, and is the basis for contrast in CT imaging.
\[I = I_0 e^{-μ(E)x}\]
where I0 is the initial intensity, I is the transmitted intensity, x is the object thickness, and μ(E) is the energy-dependent linear attenuation coefficient. Note the exponential decay of the intensity as the beam passes through the material. Higher-density and higher Z materials will attenuate more photons.
\[HU = 1000 \frac{\mu_0 – \mu_{H_2O}}{\mu_{H_2O}}\]
HU are defined such that water is 0 and air is -1000. The table below gives some general ranges for several tissues in the human body.
CT numbers of different tissues for 70 keV X-rays
| Tissue | CT number (Hounsfield units) |
|---|---|
| Bone | 1000 – 3000 |
| Muscle | 10 – 40 |
| Water | 0 |
| Lipid | -50 to -100 |
| Air | -1000 |
| Brain (white matter) | 20 – 30 |
| Brain (gray matter) | 35 – 45 |
| Blood | 40 |
Image quality
Image quality is typically tested using phantoms, such as the American College of Radiology (ACR) CT accreditation phantom. The cylindrical water-filled phantom includes sections for uniformity, accuracy, linearity, and resolution. A section with just water is used for checking uniformity across the FOV. CT number accuracy and linearity are checked using rods made from water, air, polyethylene, acrylic, and bone. Resolution is tested with sections of different attenuation and a variety of separation distances. The use scans and reconstructs an image of the scanner, then draws regions of interest over several places on the uniform area, or over the rods to ensure the numbers are as expected. Details for ACR accreditation requirements can be found on the ACR website.
Artifacts
Artifacts can significantly impair image quality. Some are due to defects or broken equipment; some are due to the positioning, setup, or material being imaged.
See radiopedia for an excellent overview and examples of common artifacts.
- Tube arcing
- temporary short circuit, loss of some projections and streaks in images
- Ring artifacts
- poor calibration
- misbehaving detectors
- Beam hardening/meta artifacts
- High-density objects attenuate too many photons and images result in streaking
- Metal artifact reduction (MAR) reconstruction techniques can help
- Partial volume effects
- Object lies partially outside a slice or voxel
- smaller voxels or thinner slices can help (but increases noise)
- Object lies partially outside a slice or voxel
- Truncation
- Object lies outside field of view
- Contributes to attention
- Brightening of edges of FOV
- Object lies outside field of view
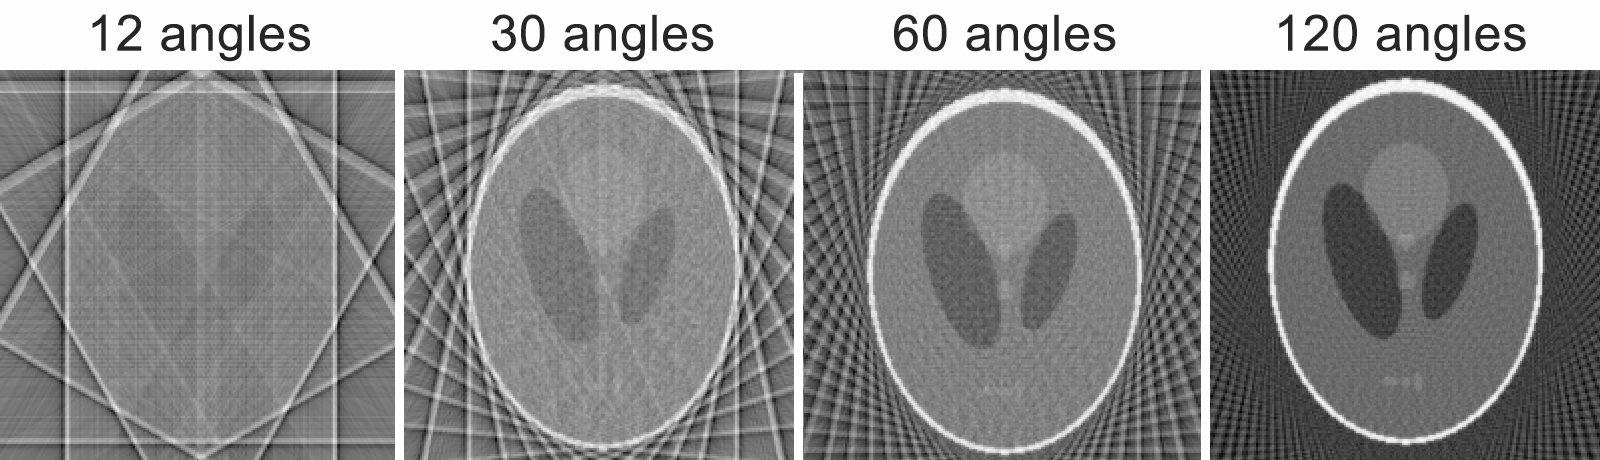
- Aliasing
- Undersampling (high pitch or too few projections)
Temporal resolution
Rotation of the gantry takes some time — typically 120-160 ms. 3D images require multiple gantry rotations and bed motion. While a basic CT scan takes only a few seconds, there is still potentially some negative effect from external motion of the patient, internal organ motion, respiratory motion, etc. Improving the temporal resolution requires decreasing imaging time, but there are limits on gantry speed and the number of projections per rotation. The use of helical scanning was a large improvement over axial.
Respiratory motion typically has the largest effect (in otherwise cooperative patients). Breath-holds may be used at inhale or exhale to limit the motion in patients who can tolerate it. Some scanners can track motion for gated or 4D CT images, where either images are acquired at only certain points in the respiratory cycle, or multiple images are taken per cycle and sorted by point in the respiratory cycle (resulting in a much higher dose). Gas/bowel movement and swallowing can also cause artifacts, typically between slices. Immobilization devices help with bulk body motion.
In the case of cardiac imaging, using two sources (“dual-source”) CT can help improve the temporal resolution by capturing twice the data in the same time, resulting in a less blurry image of the beating heart. This may be a better option than slowing the heart with beta-blockers.
Contrast
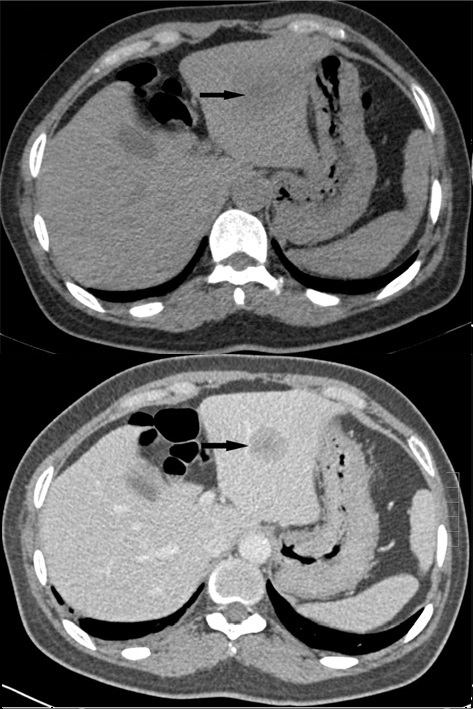
Zhenyu Pan, Guozi Yang, Tingting Yuan, Lihua Dong, Lihua Dong – (2014). “Leptomeningeal metastasis from hepatocellular carcinoma with other unusual metastases: a case report”. BMC Cancer 14 (1). DOI:10.1186/1471-2407-14-399. ISSN 1471-2407. CC-BY 2.0
As covered in the X-ray section, the choice of X-ray energy can affect image contrast. A scan at 140 kVp will have worse contrast than a scan at 80 kVp due to the relative contribution of Compton and photoelectric effects. The photoelectric effect dominates at low energies and is much more likely for bone than soft tissue, with a likelihood ~ \(Z_3/E_3\). Compton dominates at higher energies and has a low dependence on atomic number. As a result, contrast can be improved by reducing the kVp, but at the same time, lower kVp can result in more noise since more photons are attenuated.
Contrast Media
In addition to the thoughtful selection of X-ray parameters, internal contrast enhancers may be added to patients. Typically, iodine is injected into the blood pool as a high-density, high-Z material. Scans will be taken before and after injection–pre- and post-contrast. Depending on the system or organ being imaged, various delays between injection and imaging are used to enhance the desired locations. A region of interest on the aorta is drawn to track the travel of the iodine bolus through the circulatory system. Many scanners can trigger the start of a scan based on the HU value in the aorta. For instance, a pulmonary embolism might use 6-13 second delay, while hepatic imaging would use 50-60 seconds, and renal would use 80 seconds.
Radiation Dose
The basics of radiation dose are covered on the X-ray page. As a brief reminder, higher intensity means more photons and more dose. The energy of the photons and the location of the irradiation also affect the effective dose.
In CT specifically, the dose is deposited for each CT slice, and because of the many projections, the patient is effectively getting the equivalent of multiple planar images. The tomography results in roughly 10x the dose for CT vs planar X-ray.
The primary dose measurement in CT is the CT Dose Index (CTDI). It represents the average absorbed dose along the z-axis (superior/inferior). The dose is measured in a cylindrical phantom, either adult- or child-sized. The measurement is taken with a 100 mm pencil ion chamber during one axial X-ray tube rotation and integrated over a 10 cm slice, incorporating beam collimation of N slices of thickness T: \(CTDI_{100} = \frac{1}{NT} \int{D_z dz}\). However, dose varies over the scan and is higher at the periphery. As such, a weighted version of the dose index is used: \(CTDI_w = 1/3 {CTDI_{100}}_{center} + 2/3 {CTDI_{100}}_{periphery}\). One last correction for helical scans is accounting for the pitch: \(CTDI_{vol} = CTDI_{w}/pitch\). NOTE: CTDI is useful for comparing scanners and protocols; it is not a patient-specific dose.
| CT Exam Type | k Factor (mSv/mGy-cm) |
|---|---|
| Head | 0.0021 |
| Chest | 0.014 |
| Abdomen | 0.015 |
| Abdomen-pelvis | 0.015 |
| Pelvis | 0.015 |
It is also important to incorporate the axial length of the scan in dose reporting. A CT scan from head to toes will give a much larger total body dose than one that just covers the head. Dose length product (DLP) = \(CTDI_{vol} \times L\) is used to include the length, L, of the scan in cm. Combine DLP with a k-factor of the anatomical location of the scan, and one can get a rough estimate of the patient dose.
CTDI is measured with a specific phantom size (usually 32 cm for adults), and thus doesn’t account for full-body scatter or for smaller or larger patients (smaller patients will have larger doses). A better estimate can be gained using a size-specific dose estimate (SSDE) from tables provided by AAPM report 204.
| Procedure | Effective dose (mSv) |
|---|---|
| Abdominal planar X-ray | 1.5 |
| Chest planar X-ray | 0.02 |
| Lumbar spine planar X-ray | 1.5 |
| Chest CT | 7 |
| Head CT | 2 |
| Abdominal CT | 8 |
The CTDI depends on the scanner and protocol, dominated by the choice of kVp and mAs. Modern scanners use the initial scout scan or topogram to adjust the mA based on the patient thickness. This strategy is called automatic exposure compensation (AEC). Automatic tube current modulation can change the mA as the tube rotates around the patient, so thick directions, e.g., sideways through the pelvis, use higher mA while thinner directions, e.g., front to back through the pelvis, use lower mA. It is especially useful in pediatrics, where smaller patients mean less attenuation and the ability to use fewer photons (lower mAs) for the same image quality. There are typically dedicated pediatric protocols as well.
The effect of reducing the dose on image quality is mostly increased noise.
Selectable scan/image factors
- Scan field of view
- Display field of view
- Matrix size
- Slice thickness
- mA
- AEC
- kVp
- Focal spot size
- Scan time
- Pitch
- Magnification
- Reconstruction algorithm
- MAR
- Window width and level
Factors affecting spatial resolution
- Focal spot size
- a larger focal spot will worsen the resolution
- Detector size
- increase in detector size worsens resolution
- Gantry motion
- Source-detector array
- Bed motion
- Filter
- edge enhancement filters (high-pass) will have a better resolution than soft tissue filters
- Slice thickness
- the larger the slice thickness the worse the resolution
- Field of view
- as the FOV increases so do the pixel size (for a given matrix size); resulting in worse resolution
- Pixel size
- the smaller the pixel size the better the spatial resolution
- Motion of the patient
- Movement causes blur, worsening resolution
Factors affecting CNR
- kVp, mAs, pitch
- mAs is linear with noise and dose
- kVp is not linear
- Slice thickness
- Thicker slices reduce noise
- More signals combined
- Thicker slices reduce noise
- Reconstruction methods
- FBP vs iterative
- Reconstruction filter
- Resolution vs noise
Factors affecting dose
- Tube voltage (kVp)
- Increase → increase
- Current (mA)
- Increase → increase
- Rotation time (s)
- Increase → increase
- Pitch
- Increase → decrease
- Patient size
- Increase → decrease (esp periphery)
Clinical applications
CT is widely used for all sites and a variety of diseases and conditions. Some examples are listed below:
- Acute injuries to identify internal bleeding
- Stroke
- Identification of bone and lung lesions
- Comple fractures
- Solid tumor identification/localization
- Diagnose abdominal issues
- Coronary artery calcification
- Visualize blood vessels
- Guide radiation therapy
Imaging modality is typically chosen based on what can best visualize the issue while keeping dose and cost as a minimum. While in some cases an MRI may be preferable (MRI has better soft tissue contrast), it might not be worth the additional cost or difficulty scheduling.